


New Jersey’s 2020 abortion statistics were provided by the New Jersey Department of Health to the Charlotte Lozier Institute (CLI) upon request in August 2022. The statistics given to CLI also included 2019 statistics; however, this report focuses mainly on 2020 data, with some 2019 data included in Figures 1 and 2.
Statistics and Changes in New Jersey Abortions, 2019-2020
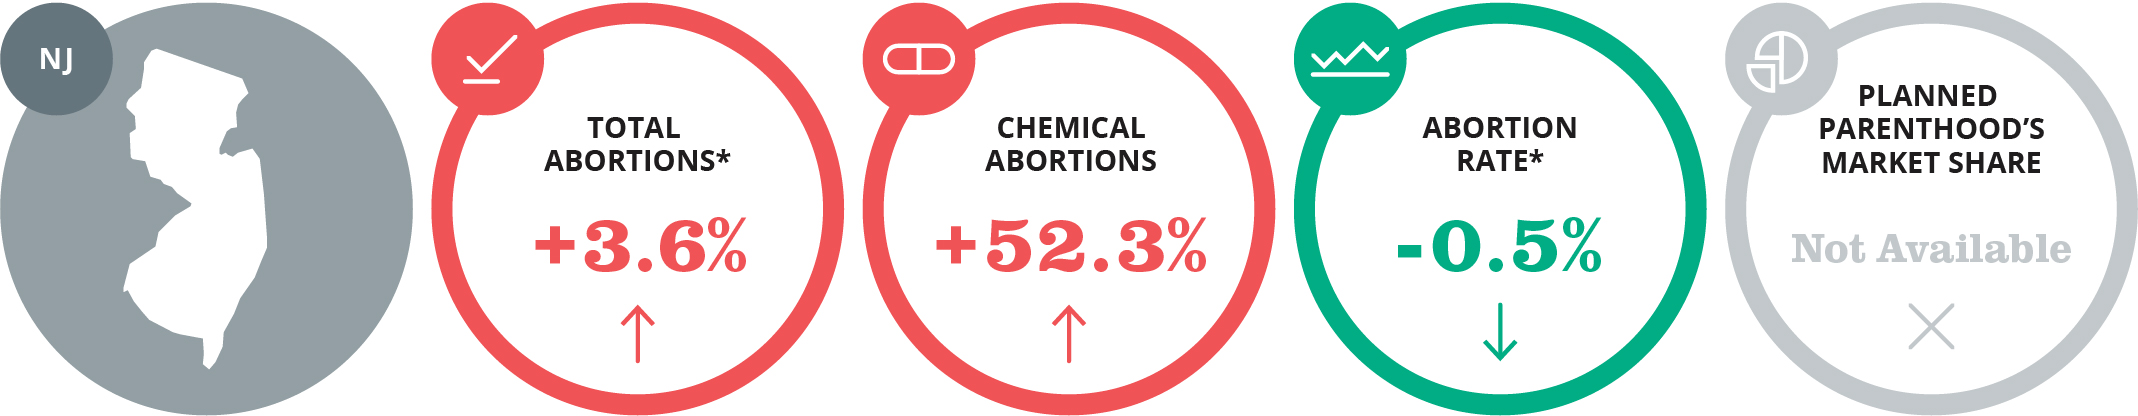
*The total number of abortions is significantly underreported, so this graphic does not capture all abortions occurring in the state. This is because New Jersey doesn’t require all facilities that perform abortions to report abortion data; only hospitals and licensed ambulatory care facilities are required to report. Information on Planned Parenthood’s New Jersey market share is not publicly available.
Abortion Totals and Trends
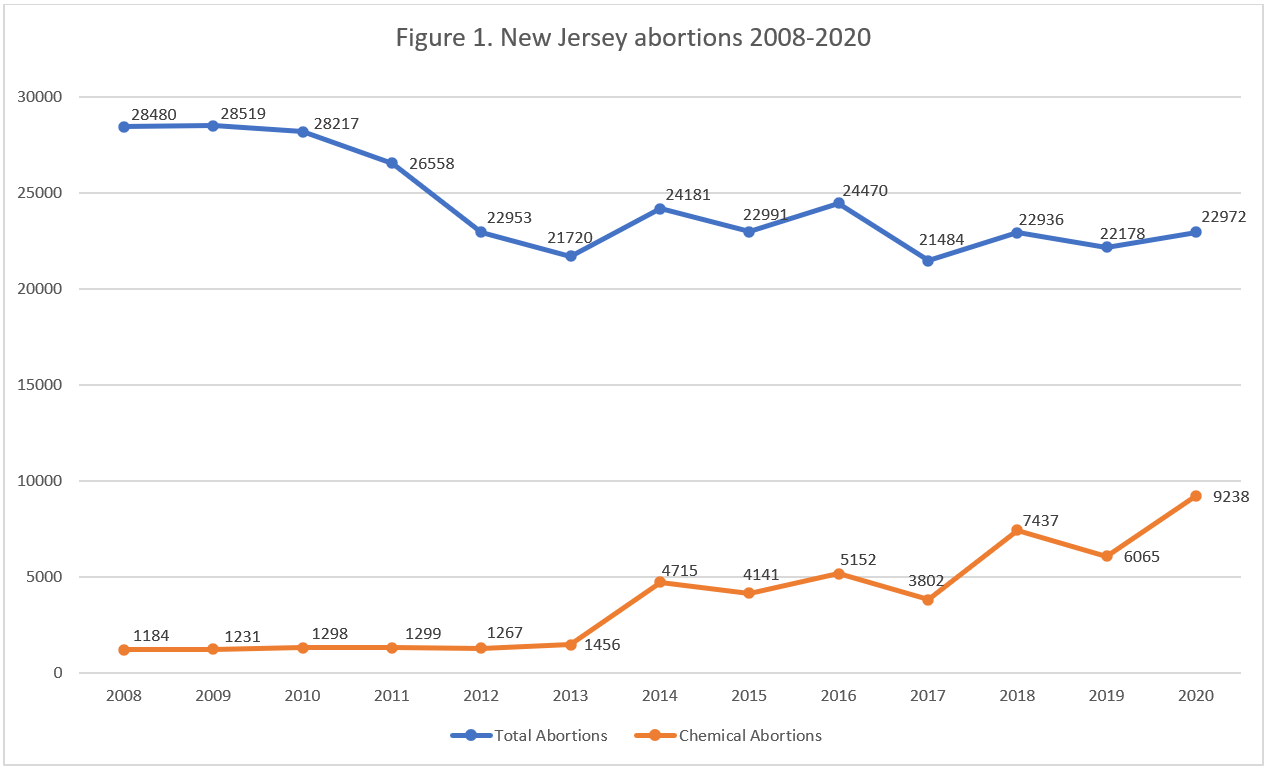
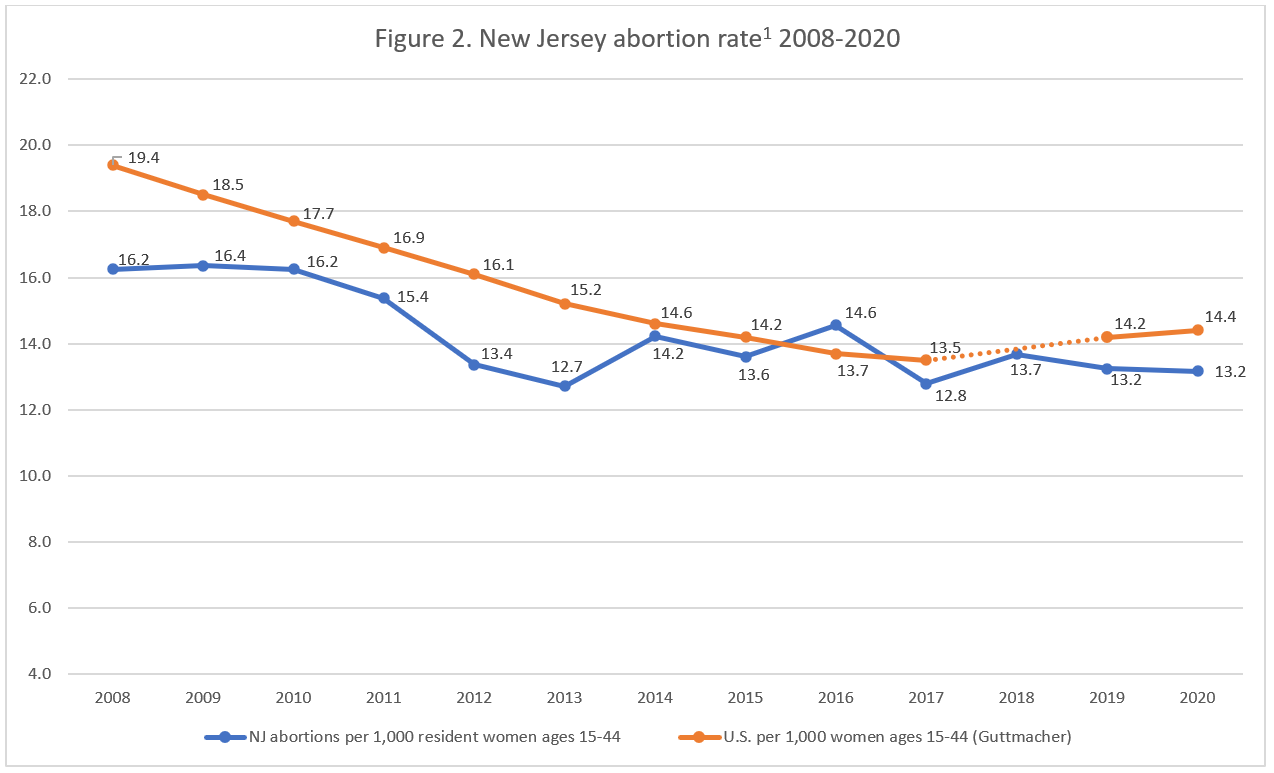
There were 22,972 abortions reported in New Jersey in 2020, up four percent from 2019 when there were 22,178 abortions reported. However, because not all New Jersey abortion centers are required to report abortions, this figure significantly undercounts the number of abortions that actually occurred in the state. Chemical abortions also increased by more than 50 percent from 2019 when there were 6,065 chemical abortions reported compared to 9,238 in 2020, although it is likely that a sizeable number of chemical abortions were not reported. This increase follows an 18 percent decrease in chemical abortions from 7,437 in 2018 to 6,065 in 2019. CLI calculates that New Jersey’s reported abortion rate in 2020 was 13.2 abortions per 1,000 women ages 15 to 44, down less than one percent from 2019 (Fig. 2).
State Report Summary
New Jersey does not have a comprehensive reporting requirement for all facilities that perform abortions. Instead, only hospitals and licensed ambulatory care facilities (LACFs) are required to report the abortions they perform. Under New Jersey’s regulations that were in effect in 2021, surgical abortions after 14 weeks of gestation were required to be performed in ambulatory care facilities and hospitals, and second-trimester procedures other than dilation and evacuation must have taken place in hospitals. Consequently, later surgical abortions are likely over-represented in New Jersey’s abortion data, because facilities other than hospitals and LACFs that were allowed to perform only early abortions are not required to report.
In 2021, New Jersey weakened its standards for abortion providers. Non-physicians are now permitted to perform surgical abortions, and abortions after 14 weeks may now be performed in doctor’s offices.
Ninety-three percent of the abortions reported in New Jersey were performed on state residents. Of the seven percent of women who traveled from out-of-state to New Jersey for abortions, the largest group came from Pennsylvania (1,080 abortions), followed by New York (298), and Delaware (121).
Nine percent of the abortions were performed on girls under the age of 20, including three percent on girls under the age of 18. Fifty-five percent of the abortions were obtained by women in their twenties, with 26 percent performed on women ages 20 to 24 and 29 percent on women ages 25 to 29. Thirty-two percent of the abortions were on women in their thirties, and five percent were performed on women ages 40 or older.
Black women were the largest racial group undergoing abortions in New Jersey, making up 38 percent of reported abortions, despite the population of white women ages 15 to 44 in New Jersey being almost four times the population of black women in that same age range. Thirty-four percent of the abortions were performed on white women, and 19 percent on women of other races, while nine percent were performed on women of unknown race. Given such a discrepancy in the number of abortions obtained by black women and white women compared to their respective populations, the black abortion rate (29.0 per 1,000 women ages 15 to 44) was four times the white abortion rate (6.7). Thirteen percent of the abortions were performed on Hispanic women, 74 percent on non-Hispanic women, and 13 percent on women whose ethnicity was not reported.
As in other states, a large majority of the abortions reported in New Jersey (85 percent) were performed on unmarried women. Thirteen percent were performed on married women and two percent on women of unreported marital status. Twenty-five percent of the abortions were on women with one previous live birth and another thirty-five percent on women with two or more prior births, compared to 39 percent on women who had not had a live birth. In contrast, over half (56 percent) of the abortions were on women with no prior abortions. Twenty-two percent each were performed on both women with one previous abortion and women with two or more previous abortions.
As expected, surgical abortions composed a large percentage (60 percent) of New Jersey’s reported abortions. Forty percent were chemical abortions, a category in the state report that includes both early chemical abortions and later induction abortions. Most of the chemical abortions occurred early in pregnancy: 98 percent were reported at 10 weeks of gestation or earlier, compared to less than one percent at 11 weeks or later and not quite two percent at unknown gestational ages.
Overall, 42 percent of the abortions reported in New Jersey occurred at six weeks of gestation or earlier. Twenty-six percent were performed between seven and eight weeks, and 12 percent occurred from nine to 10 weeks. Five percent were performed between 11 and 12 weeks of gestation, four percent between 13 and 14 weeks, and another four percent from 15 to 17 weeks. Two percent were performed at between 18 and 19 weeks and another two percent at 20 weeks or later, when there were 539 abortions performed. Two percent occurred at unreported gestational ages.
Legislative Changes
In January 2022, Governor Phil Murphy (D) signed the Freedom of Reproductive Choice Act into law. This law codifies a woman’s right to an abortion, at any stage of pregnancy, in the state of New Jersey. Abortion was already legal at any stage of pregnancy before this bill was signed into law, but the codification of abortion as a “right” into state law allows the state to be immune to any potential abortion restrictions introduced in the state legislature after the Dobbs v. Jackson Women’s Health Organization decision returned abortion regulations back to elected officials in June 2022. The law also established a study that potentially could dictate mandatory abortion coverage in private insurance plans.
State Ranking
In 2016, CLI evaluated abortion reporting in the 50 states, the District of Columbia, and New York City, and New Jersey’s reporting tied for last place. New Jersey could improve its reporting by requiring that all facilities report abortions, including doctor’s offices and non-physician providers. New Jersey could also provide additional information on where abortions take place and whether any complications occur.
- Starting with the 2018 abortion reports, abortion rates are calculated by the Charlotte Lozier Institute to allow for easier state-to-state and year-to-year comparisons. Rates were calculated by CLI using population estimates from the United States Census Bureau. The rates were calculated using the following formula: (abortions reported in New Jersey ÷ number of resident women ages 15-44) x 1,000. Rates may differ slightly from previous CLI articles due to revised population estimates. Estimates for 2005-2009 are intercensal estimates of the July 1 resident population. Estimates for 2010-2019 are Vintage 2020 postcensal estimates of the July 1 resident population. Estimate for 2020 is a Vintage 2021 postcensal estimate of the July 1 resident population. Estimates were produced by the U.S. Census Bureau and the National Center for Health Statistics.