


New York City’s 2023 abortion statistics were published online as part of the city’s vital statistics report in early 2026. This data does not include the number of mail-order abortion drugs prescribed by licensed abortion providers in other states to New York City residents or the number of self-managed abortions performed by women outside of the healthcare system. It is unclear if New York City’s reported total includes the number of mail-order abortion drugs prescribed by licensed abortion providers in New York.
Statistics and Changes in New York City Abortions, 2022-2023
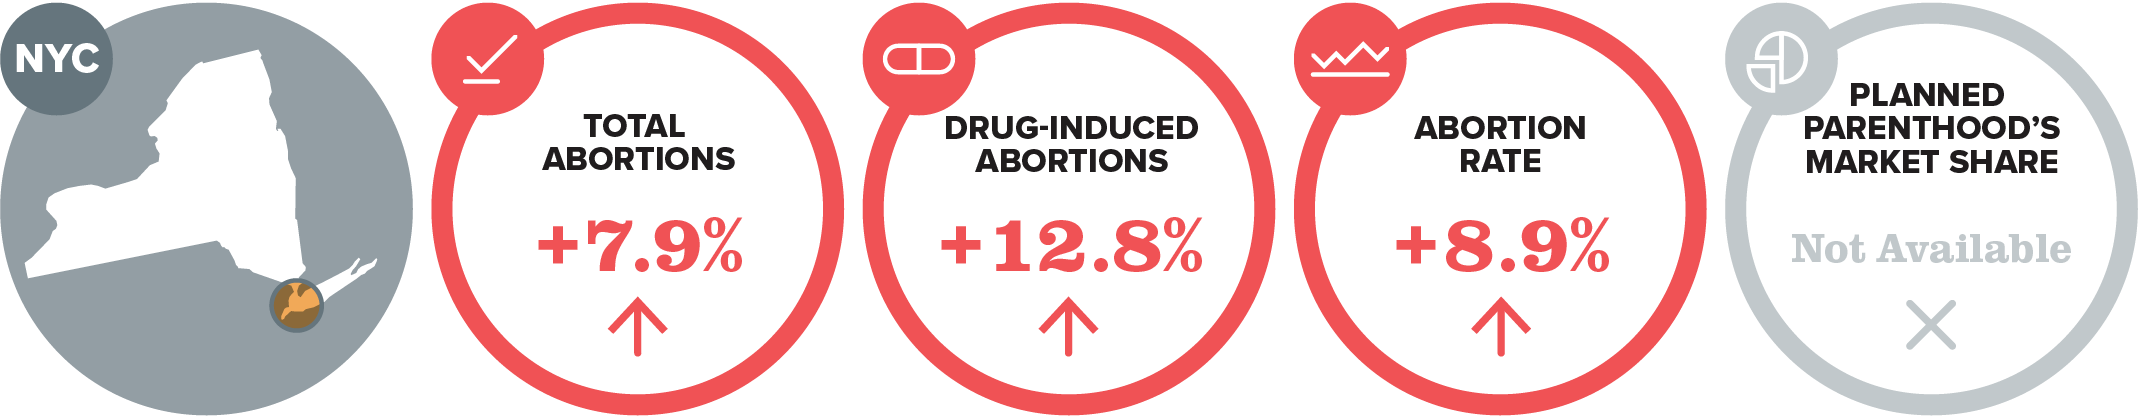
The report does not include information on Planned Parenthood’s New York City abortion market share.
Abortion Totals and Trends
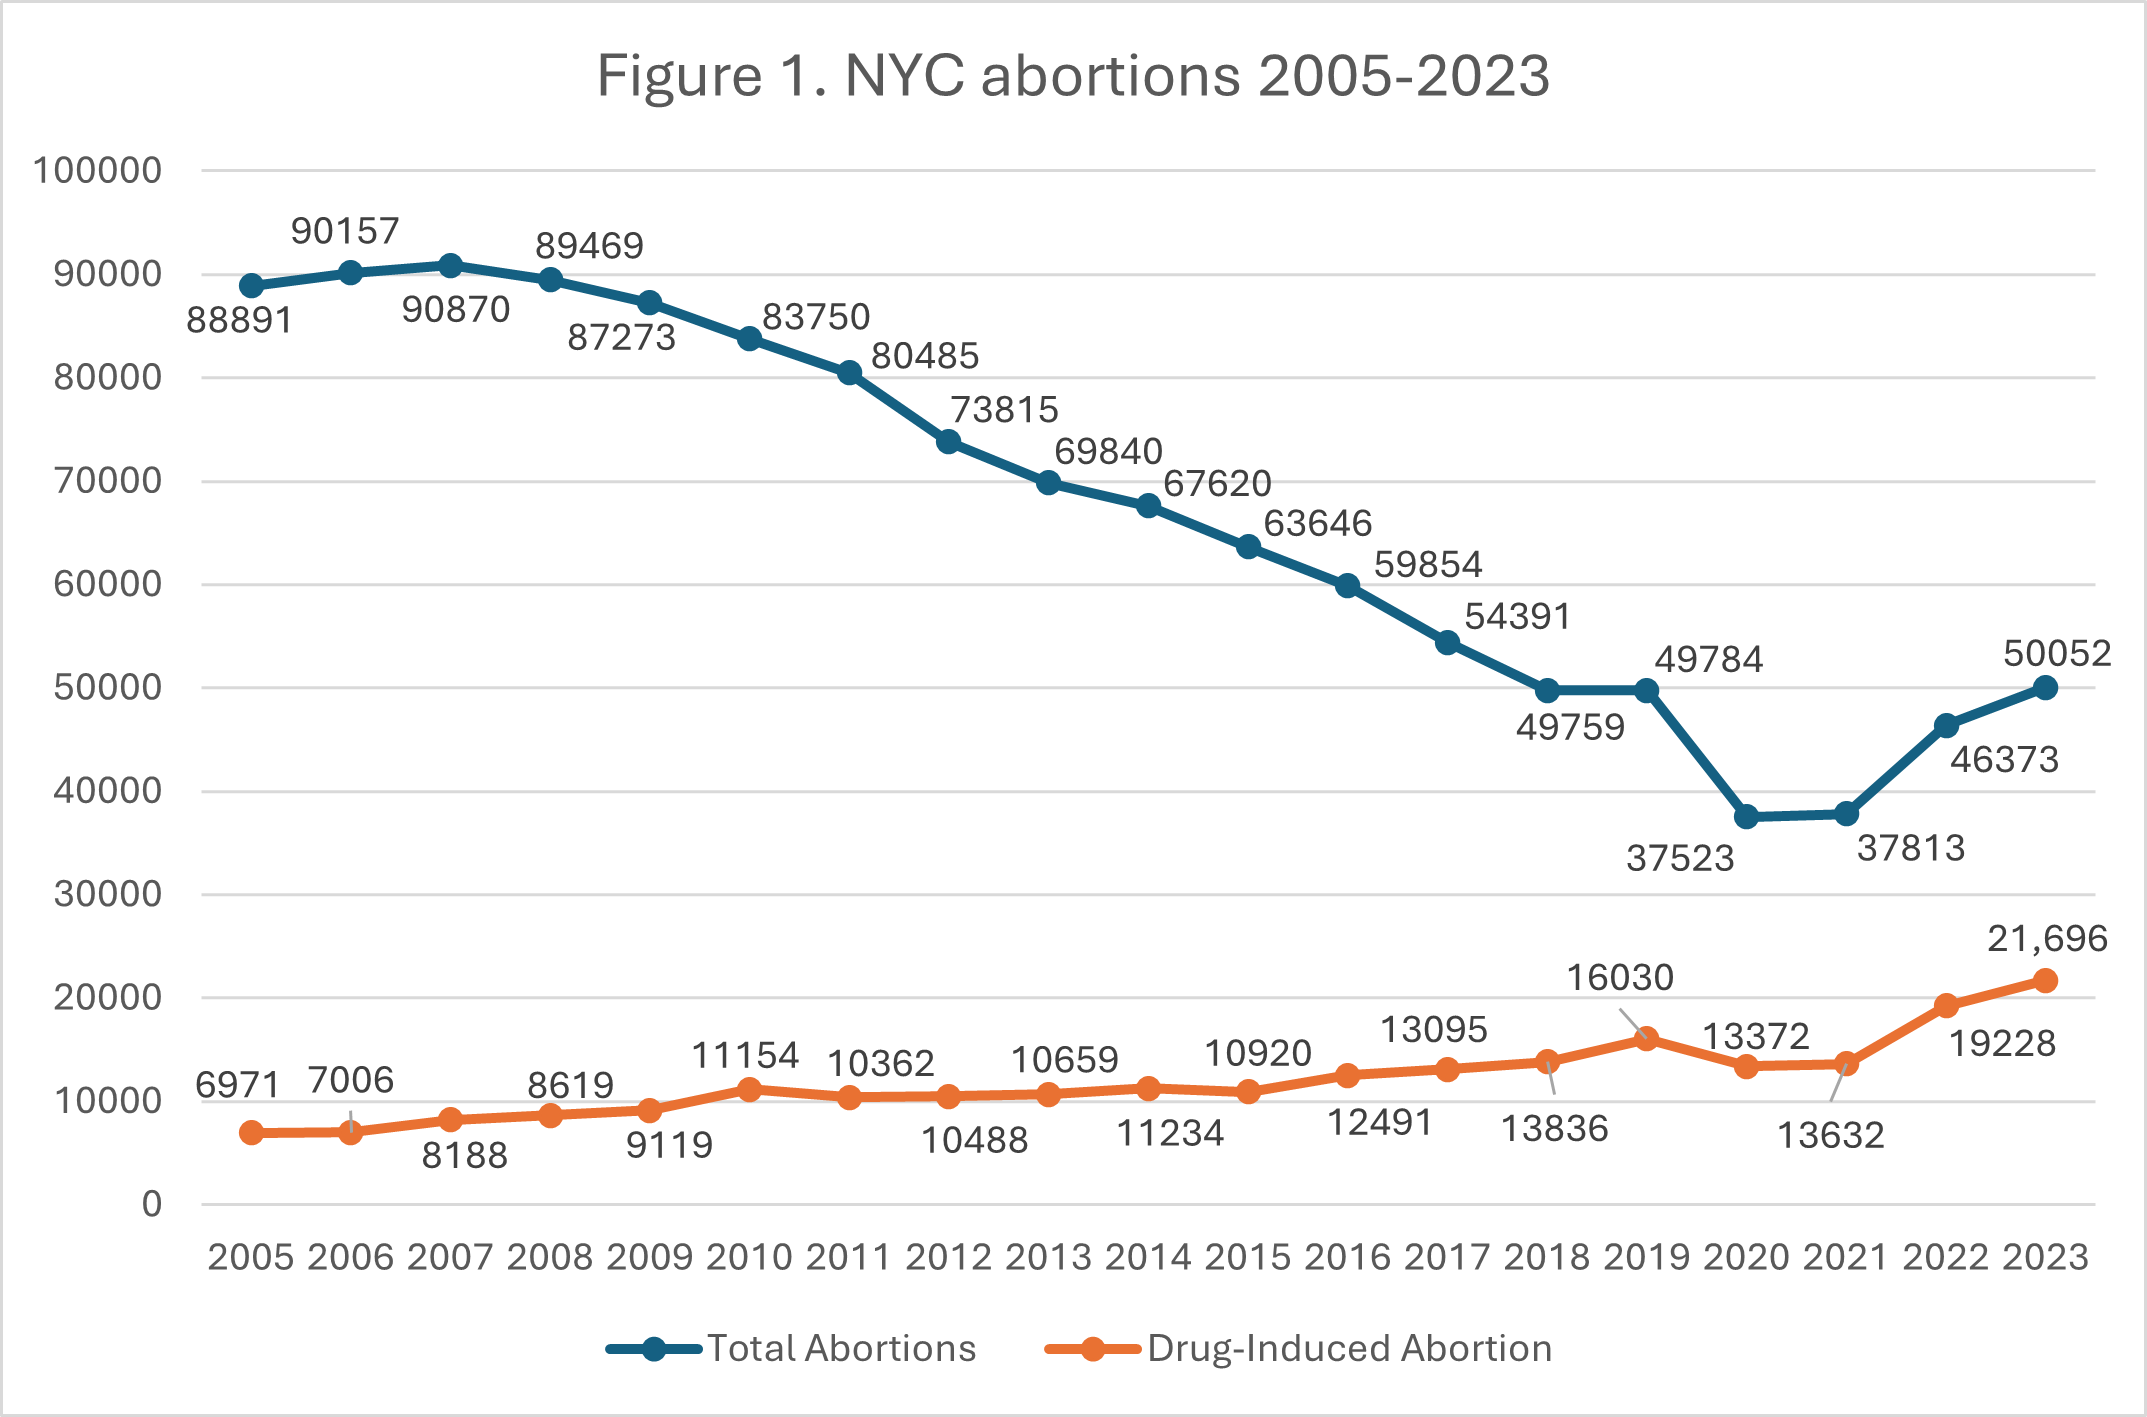
New York City’s 2023 abortion statistics showed an increase in the number of abortions occurring from 2022 to 2023, with 50,052 abortions reported in the city in 2023, an 8% increase from 2022. There were 21,696 drug-induced abortions in New York City in 2022, an increase of 13% from 2021 (Fig. 1). The Charlotte Lozier Institute (CLI) estimates that New York City’s 2023 abortion rate was 28.5 abortions per 1,000 women ages 15 to 44 (Fig. 2).1
State Report Summary
Eighty-seven percent of New York City abortions were performed on city residents in 2023: 27% were performed on residents from Brooklyn, 22% from Queens, 22% from the Bronx, 13% from Manhattan, and 3% from Staten Island. Thirteen percent of New York City abortions were performed on women who did not live in the city. New York state’s induced abortion tables also report on the number of abortions performed on city residents, however, the number in the New York state report (45,715) is different from the one in New York City vital statistics summary (43,513). Furthermore, both the state’s and the city’s reported totals for each of New York City’s five boroughs differed. This discrepancy is not explained. To see the discrepancies between the state’s and city’s reports regarding abortions by New York City borough, see below:
| Borough (County) | # of NYC Abortions in 2023, Reported by the State | # of NYC Abortions in 2023, Reported by the City | # Difference Between State and City NYC 2023 Abortion Totals |
| Bronx (Bronx County) | 12,033 | 11,064 | +969 |
| Brooklyn (Kings County) | 13,679 | 13,532 | +147 |
| Manhattan (New York County) | 6,659 | 6,308 | +351 |
| Queens (Queens County) | 11,920 | 11,205 | +715 |
| Staten Island (Richmond County) | 1,424 | 1,404 | +20 |
| New York City Total | 45,715 | 43,513 | +2,202 |
Eight percent of New York City abortions were obtained by girls under the age of 20, with 5% performed on girls ages 18 or 19 and 3% on girls ages 17 and younger. A quarter of abortions were performed on women ages 20 to 24, and 28% on women ages 25 to 29. Twenty-three percent were obtained by women ages 30 to 34, and 13% by women ages 35 to 39. Five percent were performed on women ages 40 or older.
Forty-four percent of the abortions reported in New York City occurred at six weeks of gestation or earlier. Twenty-eight percent were performed between seven and eight weeks, and 11% were reported between nine and 10 weeks of gestation. Five percent occurred between 11 and 12 weeks, and another 5% occurred between 13 and 15 weeks. Four percent of New York City abortions occurred between 16 and 20 weeks of gestation. There were 1,319 abortions (3% of the total) reported at 21 weeks of gestation or later. Abortions increased in nearly every gestational age group from 2022 to 2023 with only the number of abortions performed between nine and 10 weeks decreasing slightly (-1%). The most significant increases were as follows: a 14% increase in abortions performed before six weeks of gestation, a 20% increase in abortions performed between 16 and 20 weeks, and a 25% increase in abortions performed at 21 weeks or later.
Pregnancy Outcomes by Race
Non-Hispanic black women obtained the largest percentage of abortions in New York City in 2023, accounting for 33% of the total. Nine percent of the abortions were obtained by non-Hispanic white women, and 30% by Hispanic women. Five percent were performed on Asian or Pacific Islander women, and 4% percent on women of other races. These calculations likely underestimate the percentage of pregnancies ending in abortion because New York City abortion data is exceedingly incomplete, with race unreported for 19% of abortions that occurred in New York City in 2023. For more details about the racial discrepancies in pregnancy outcomes, see the following table2:
| % of preg. ending in abortions | % of preg. ending in miscarriage | % of preg. ending in live births | |
| Non-Hispanic Black | 48% | 3% | 48% |
| Non-Hispanic White | 11% | 3% | 86% |
| Hispanic | 32% | 3% | 65% |
| Asian/Pacific Islander | 15% | 2% | 82% |
To see the discrepancy in abortion rates and ratios between non-Hispanic black and white women in New York City in 2022, see the following table:
| Abortion Ratio (# of abortions/# of live births *1,000) | Abortion Rate (# of abortions/population of women ages 15-44 * 1,000) | |
| Non-Hispanic Black | 993 | 43.8 |
| Non-Hispanic White | 127 | 8.2 |
Breakdown of Abortion Providers by Borough and Total Number of Abortions3
| # of Abortion Providers within the Borough | Total # of Abortions Performed within the Borough, 2023 (% of city’s total abortions) | % Change from 2022 | |
| Bronx | 7 | 8,866 (18%) | 24% increase |
| Brooklyn | 14 | 9,449 (19%) | 3% decrease |
| Manhattan | 22 | 17,144 (34%) | 5% decrease |
| Queens | 11 | 12,576 (25%) | 14% increase |
| Staten Island | 2 | 517 (1%) | 56% increase |
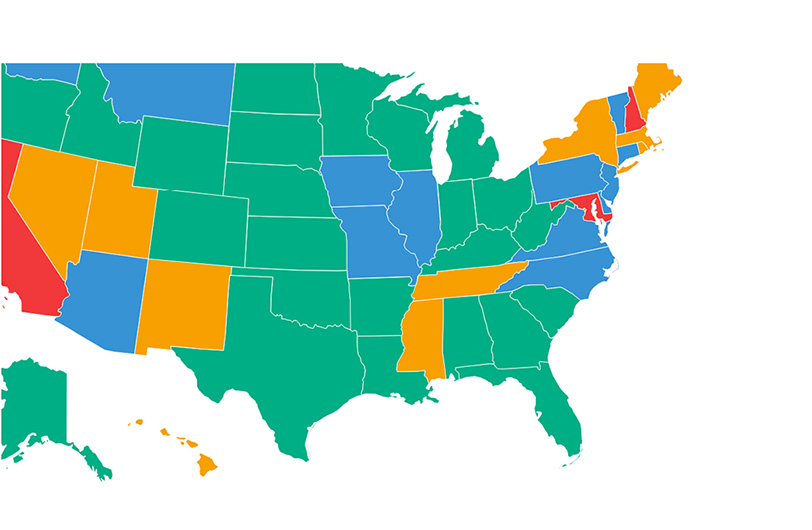
State Ranking
In 2024, CLI published a paper reevaluating abortion reporting requirements across the country, with New York City ranking as tied for 38th place. New York City could improve its reporting by ensuring that abortion pills sent via mail are reported to the city. This could be done by reviewing the city’s abortion reporting requirements to make sure that the requirements are applicable to all practitioners who prescribe abortion-inducing drugs to New York women, regardless of where the abortion provider is physically located. Lastly, New York City could publish data in a more expedited manner and aim to keep the percentages of unknown demographic categories under 10%.
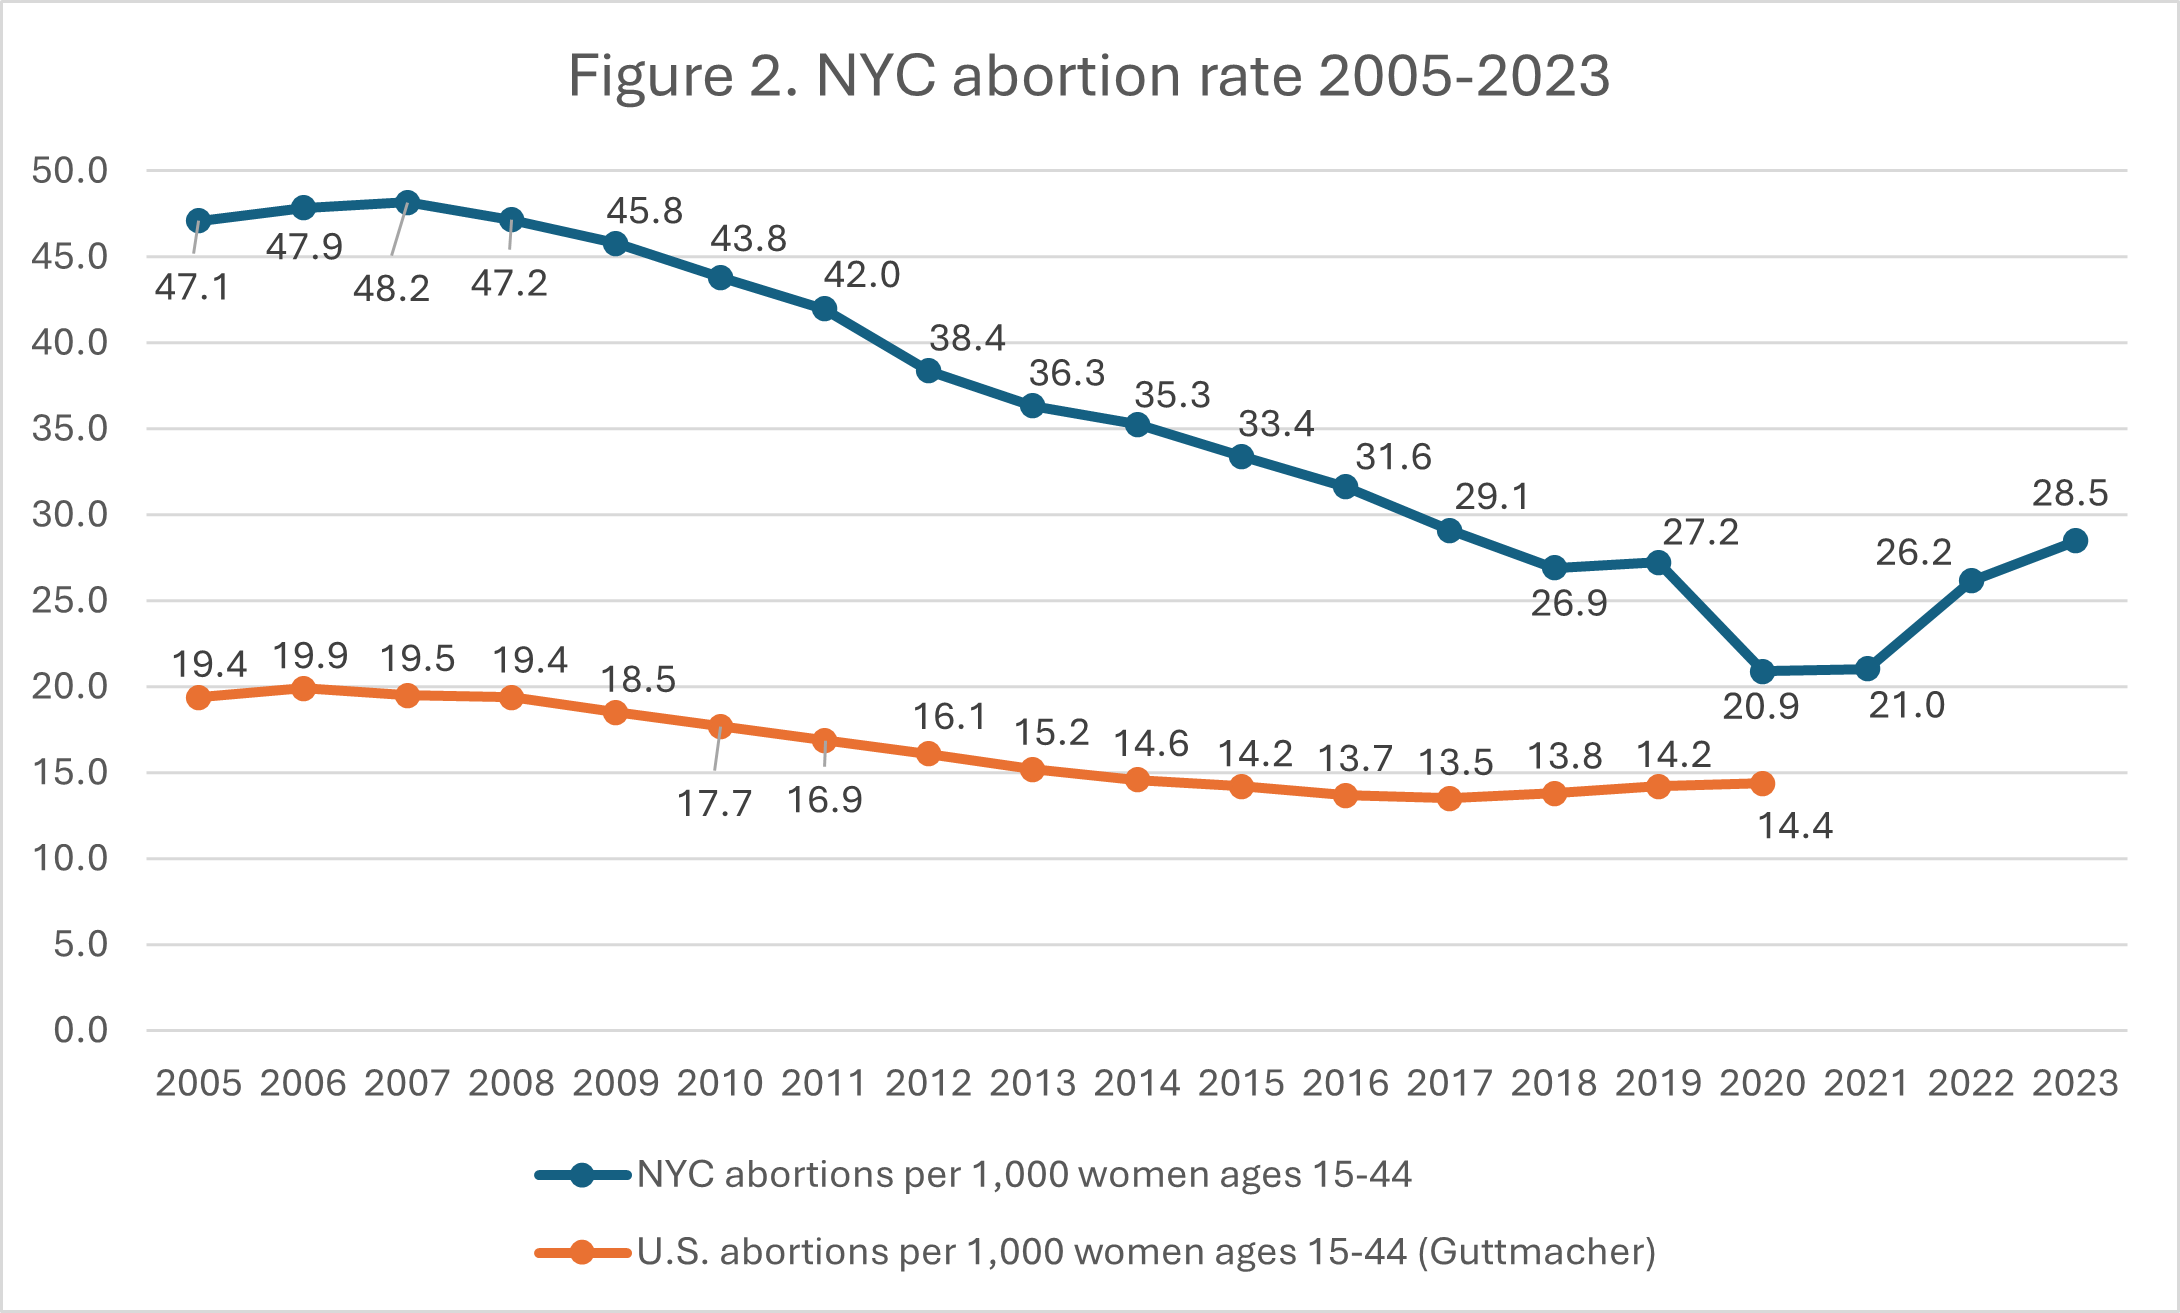
- National rates were calculated by the Guttmacher Institute. New York City rates were calculated by CLI using the following formula: (total number of abortions performed in New York City ÷ number of resident women ages 15-44) x 1,000. Rates may differ slightly from previous CLI articles due to revised population estimates. Population estimates were obtained from CDC WONDER. Estimates for 2005-2009 are intercensal estimates of the July 1 resident population. Estimates for 2010-2020 are Vintage 2020 postcensal estimates of the July 1 resident population. Estimates were produced by the U.S. Census Bureau and the National Center for Health Statistics. 2022 and 2023 population estimates were calculated using totals from Table PC2, “Population Estimates by Age, Mutually Exclusive Race and Hispanic/Latino Origin, and Sex, New York City, 2023,” within New York City’s 2023 vital statistics summary.
- The percentages were calculated from data provided by New York City’s Bureau of Vital Statistics in Table PO21, “Pregnancy Outcomes, Pregnancy Outcome Rates, and Pregnancy Rates by Woman’s Age Group, Racial/Ethnic Group, and Borough of Residence, New York City, 2023.”
- Provider totals do not include hospitals or physician offices not listed in databases that compile abortion provider locations in different states, but do include Planned Parenthood locations, independent abortion centers, and hospitals/doctor’s offices included in databases like Abortion Finder and Ineedana. This information is updated as of March 31, 2026.