


Arizona’s 2024 abortion report was published in December 2025 by the Arizona Department of Health Services (ADHS). Abortions slightly decreased in the state in 2024 compared to 2023. Below, Charlotte Lozier Institute (CLI) summarizes the information in the abortion report published by the state.
The data published by Arizona does not include the number of abortions obtained by Arizona residents out of state or the number of self-managed abortions on women outside of the healthcare system. The report also does not contain the number of mail-order abortion drugs obtained by Arizona residents prescribed by licensed providers in other states under shield laws. CLI will describe data provided by the Guttmacher Institute’s Monthly Abortion Provision Study that details the total number of abortions occurring in the state in 2024 as estimated by Guttmacher’s sample survey and mathematical models. CLI will also describe Guttmacher’s estimated number of abortions obtained by Arizona women in other states. Guttmacher’s abortion estimates include the number of abortions obtained at brick-and-mortar facilities and those provided via telehealth and virtual providers in the United States to Arizona residents under other states’ shield laws.
Arizona’s statute code defines abortion as “the use of any means to terminate the clinically diagnosable pregnancy of a woman with knowledge that the termination by those means will cause, with reasonable likelihood, the death of the unborn child” (Ariz. §36-2151). For the majority of 2024 (through November 24), abortion was limited after 15 weeks of gestation except in cases where the mother’s life or physical health was threatened by a continued pregnancy. This law was permanently struck down by an Arizona court in March 2025. Currently in Arizona, abortion is widely available throughout pregnancy because of the state’s ineffective gestational limit at viability. While the language of the law limits abortion after viability, the law contains a broad health (life and health of the mother) exception that doesn’t differentiate between physical and mental health, which, in turn, allows abortion throughout pregnancy for nearly any reason (Ariz. Prop. 139). This law was a result of the passage of Proposition 139, which Arizonans voted for in early November 2024. The proposition went into effect on November 25, 2024.
Statistics and Changes in Arizona Abortions, 2023-2024
Abortion Totals and Trends
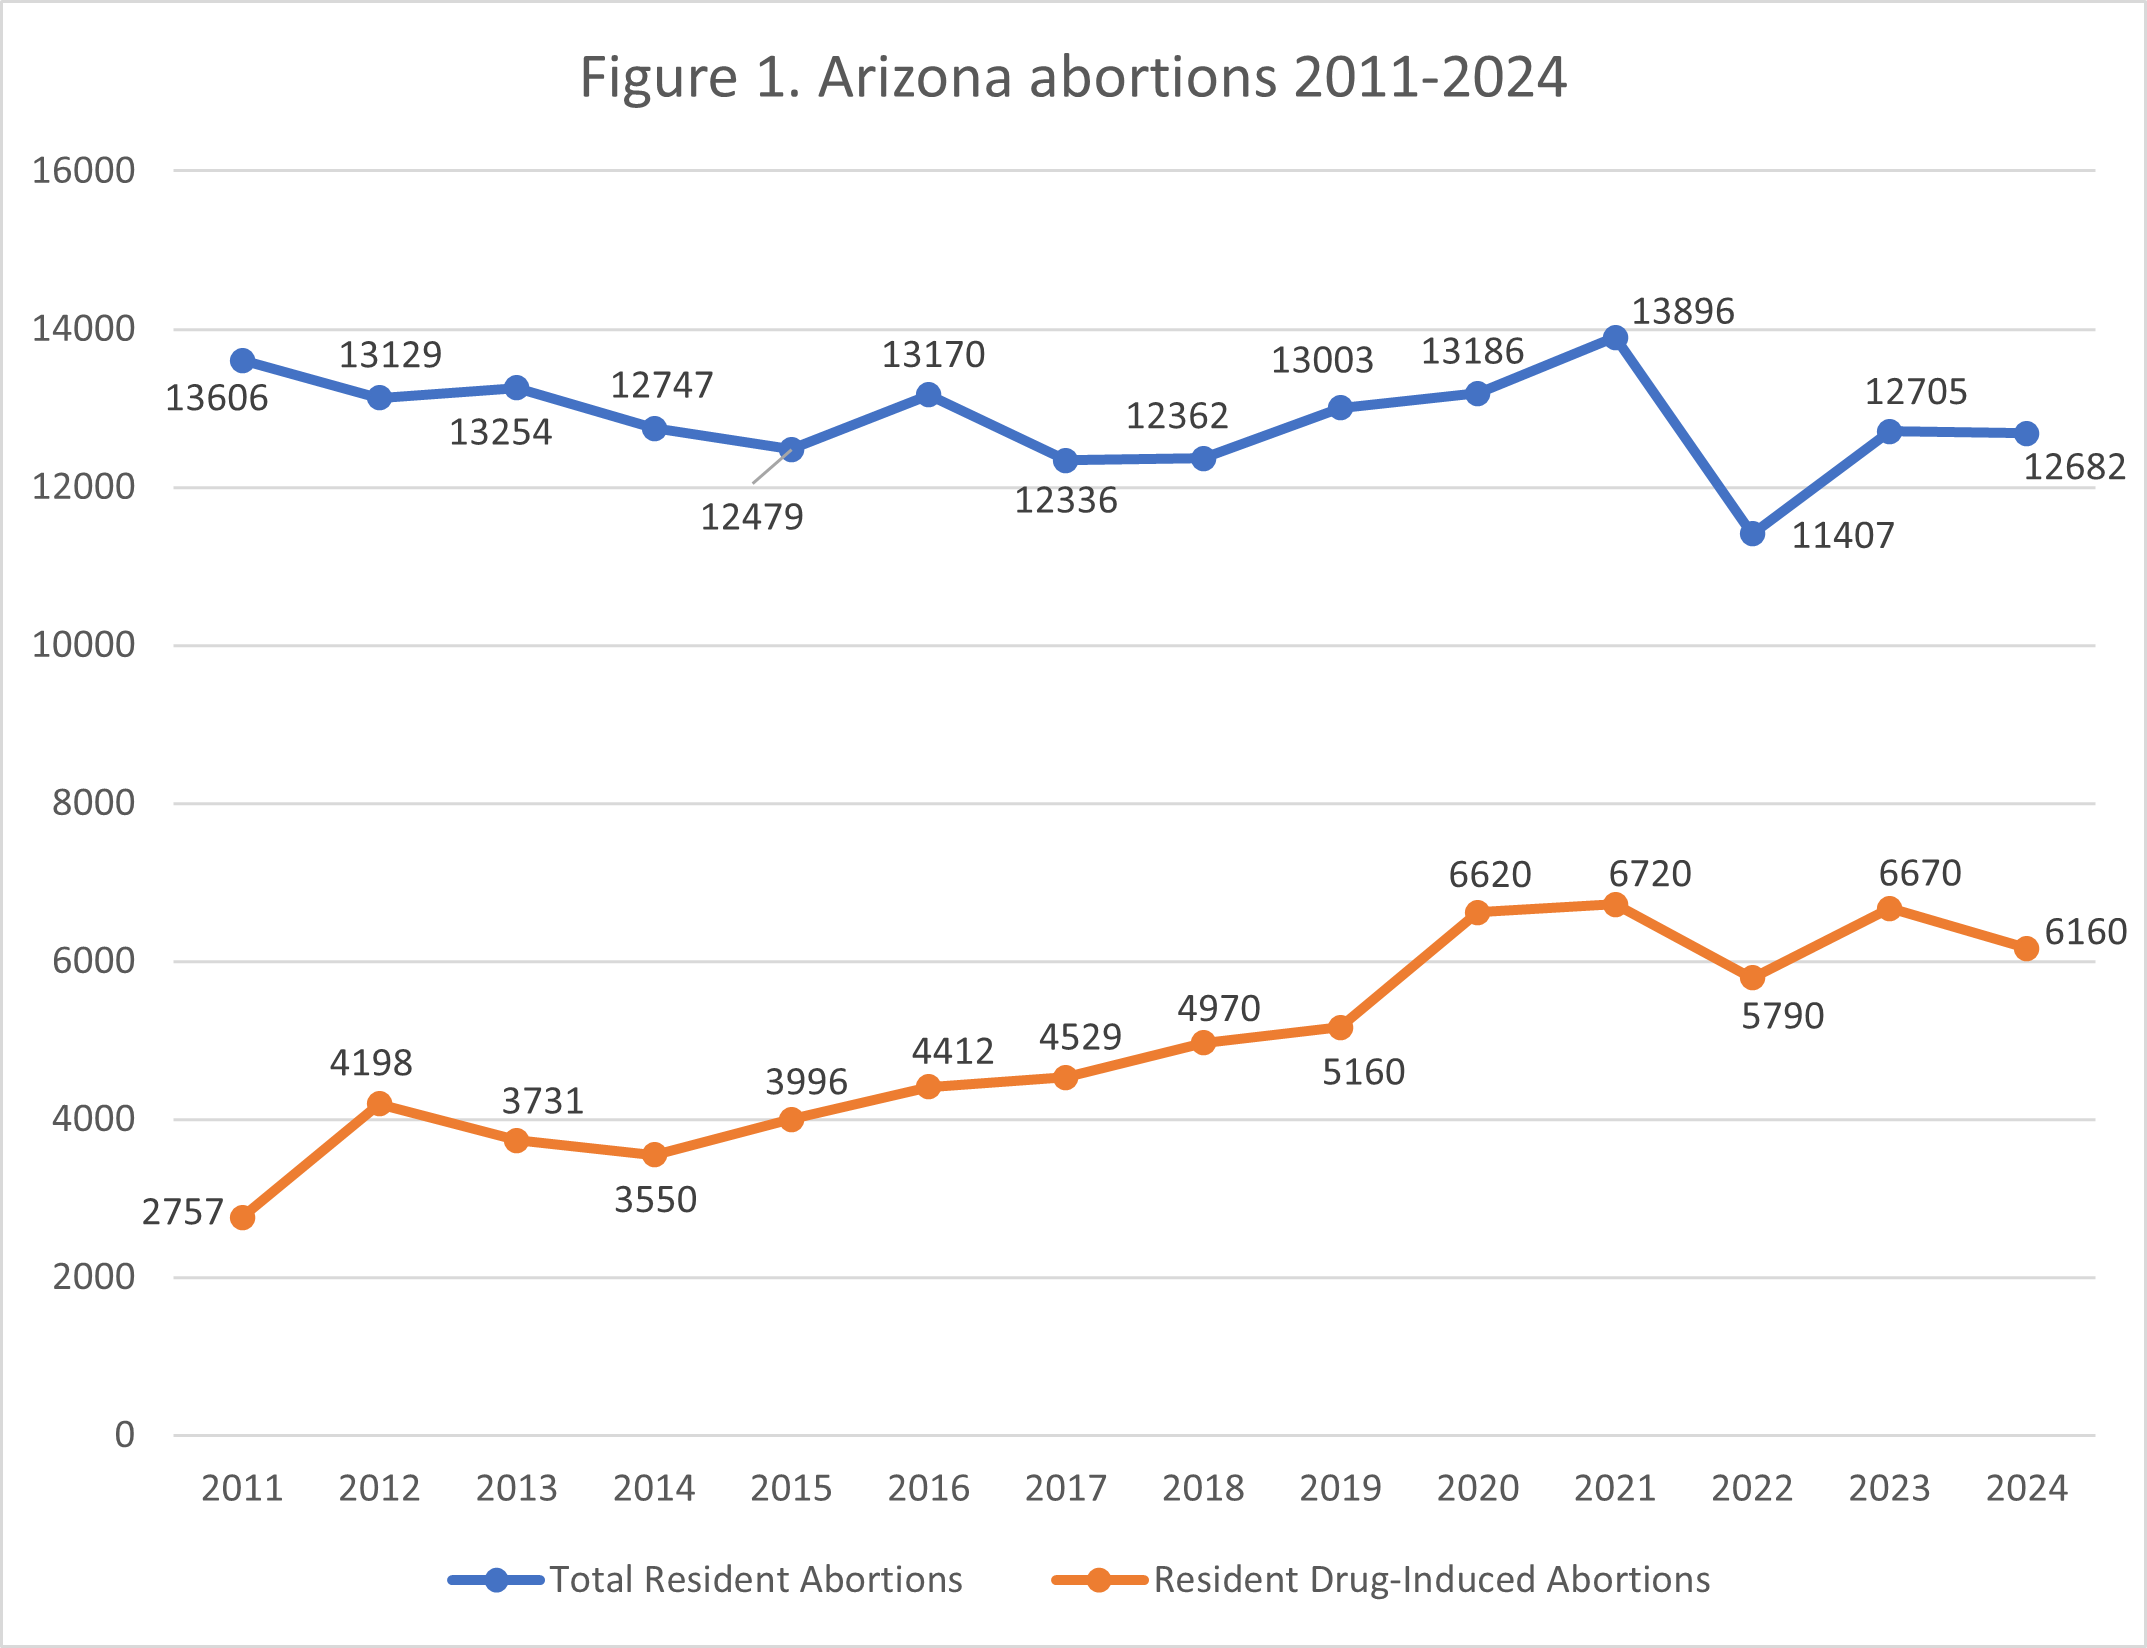
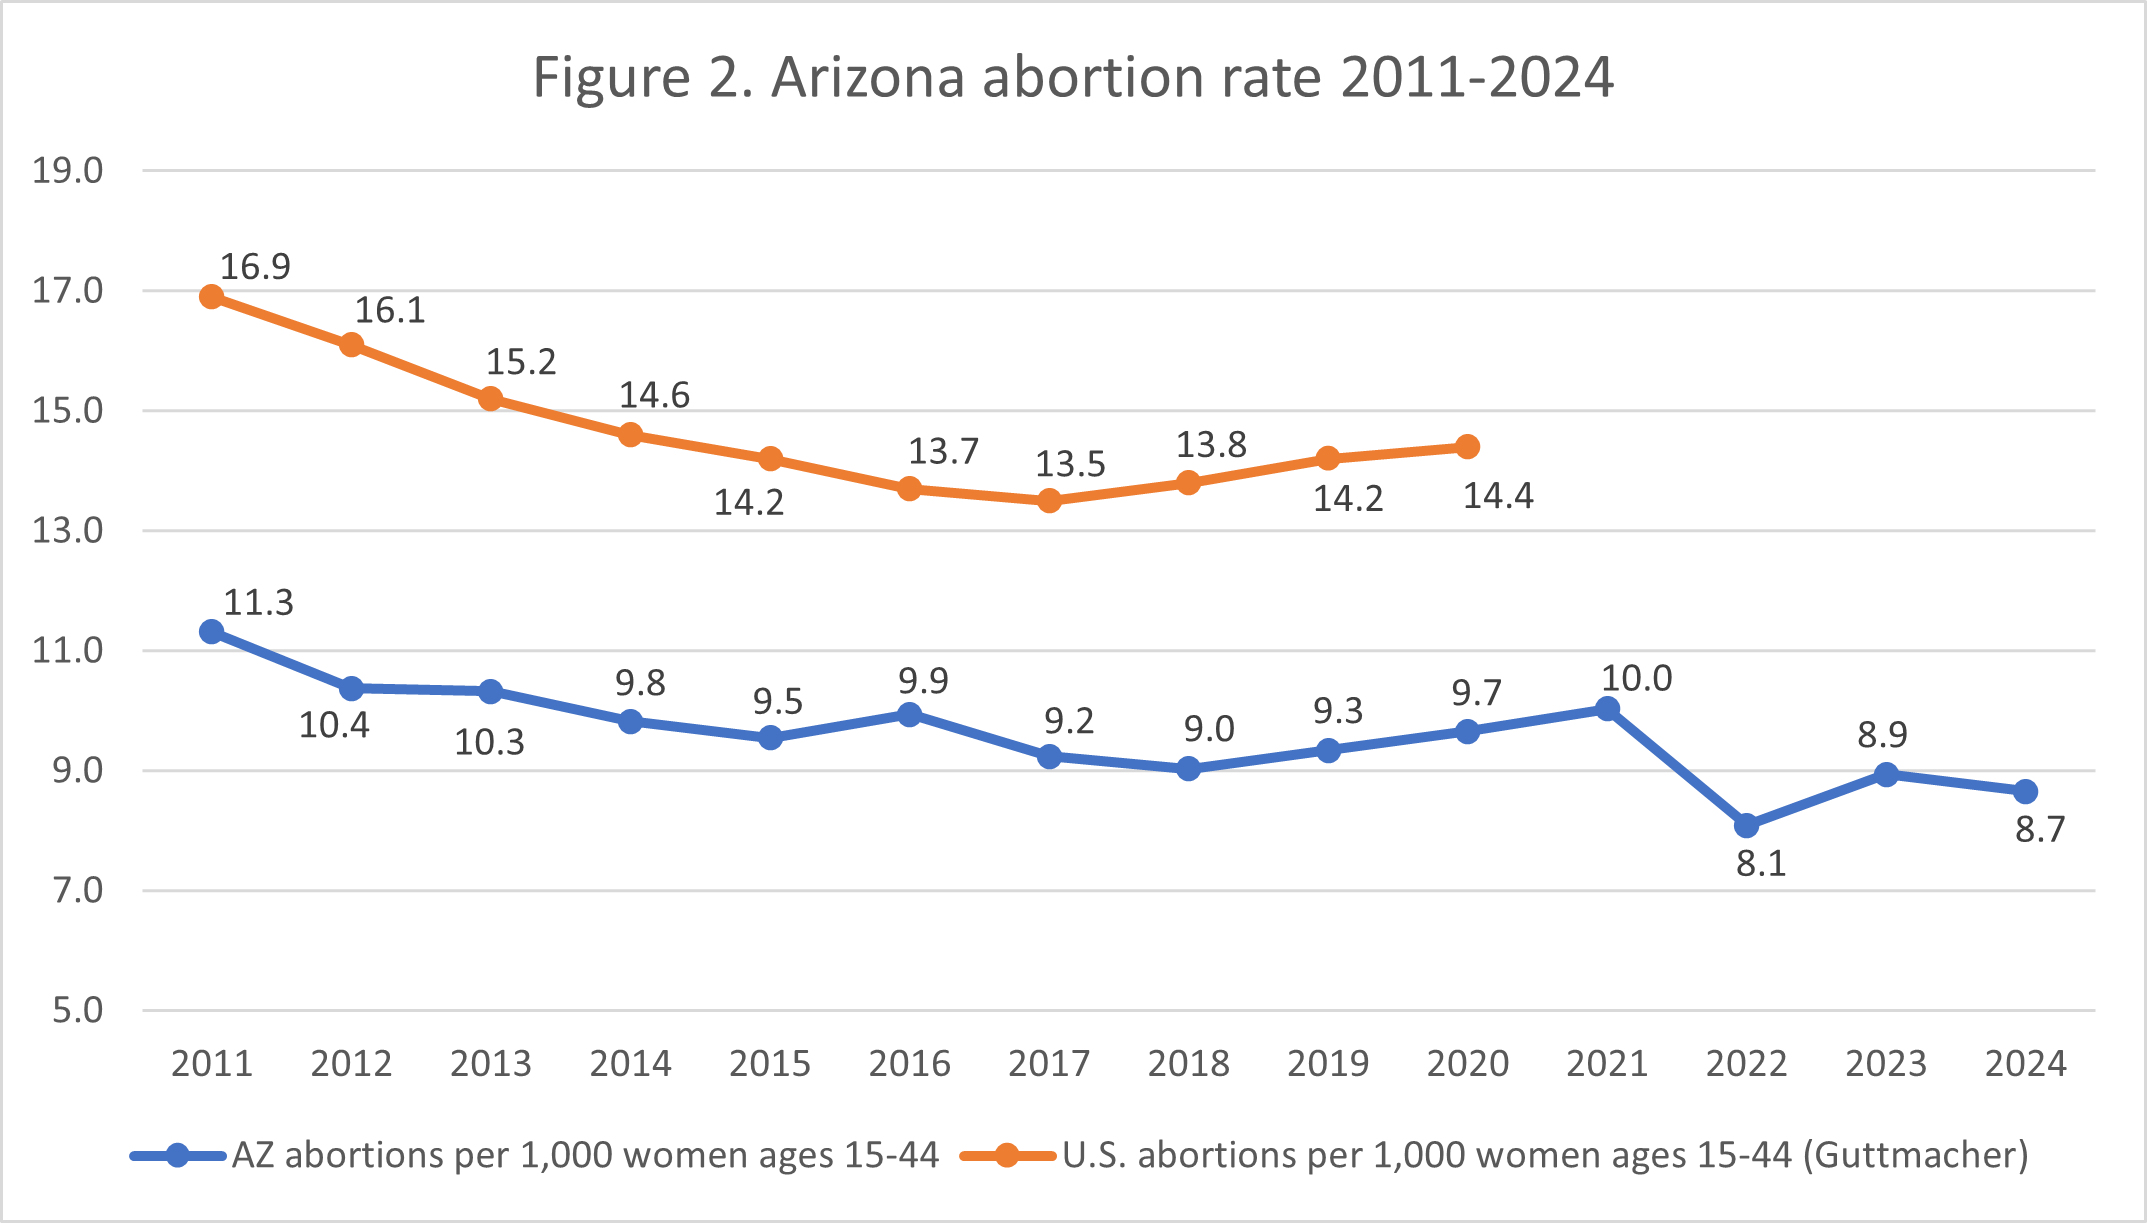
In 2024, there were 12,823 reported brick-and-mortar abortions in Arizona, a decrease of 0.5% from 2023. Abortions performed on Arizona residents decreased by 0.2%, while drug-induced abortions decreased by 7.6% (Fig. 1). CLI estimates that Arizona’s state abortion rate was 8.7 abortions per 1,000 women ages 15 to 44 (Fig. 2).1 As of January 2026, 24 states have released 2024 abortion data, with 10 states showing decreases in abortion in 2024.
State Report Summary
Resident Demographic Data
Of the abortions performed in Arizona in 2024, 12,682 (99%) were performed on Arizona residents. One percent of abortions (141) occurring in Arizona were performed on nonresident women, a 23% decrease from 2023, when 183 nonresident women obtained abortions in Arizona. Most of the demographic information in the report is for reported resident abortions only.
Nine percent of Arizona-reported resident abortions were performed on girls under the age of 20, with 2% on girls ages 17 or younger and 7% on girls ages 18 and 19. Thirty percent of the abortions were obtained by women ages 20 to 24, and 29% by women ages 25 to 29. Twenty-nine percent were performed on women in their thirties, and 4% on women ages 40 and older. In Arizona, parental consent is required before an abortion may be performed on a minor under the age of 18. In 2024, 21 minors filed petitions asking judges to waive the parental consent requirement, of which all 21 were granted.
Arizona reports race and ethnicity together, and in 2024, 47% of Arizona resident abortions were obtained by Hispanic women. Twenty-eight percent of the abortions were performed on non-Hispanic white women, and 11% were performed on African American women. Four percent of Arizona resident abortions were obtained by Asian or Pacific Islander women. Three percent of the abortions were performed on American Indian women, and 2% on women of multiple races. Race was not reported for 5% of the resident women who obtained abortions in Arizona. CLI estimates that the black abortion rate was 17.2 abortions per 1,000 women of childbearing age, over three times the white abortion rate of 5.5.
Typically, Arizona reports the number of abortions by level of education attained. However, for 2024, the percentage of abortions obtained by women of an unknown educational level was 43.2%, making this data category unreliable.
Eighty-six percent of Arizona abortions were performed on unmarried women, while 14% were performed on married women. Sixty-five percent of the abortions were obtained by women with at least one prior pregnancy. Twenty-one percent of the abortions were performed on women with one previous live birth, 31% on women with two or more prior births, and 46% on women with no previous live births. Sixty-two percent of Arizona resident abortions were performed on women with no previous abortions, compared to 23% on women with one prior abortion and 12% on women with two or more abortions. Seventeen percent of Arizona abortions were performed on women who had previously had a miscarriage. The number of previous live births was not reported for 3% of Arizona resident abortions, while the number of previous pregnancies, abortions, and miscarriages was not reported for 3%, 4%, and 6% of Arizona resident abortions, respectively.
Medical Information
Forty-nine percent of the abortions were performed using abortion drugs, of which the vast majority (99.7%) were induced using mifepristone. Fifty-one percent were surgical abortions, of which the vast majority (72.2%) were performed using suction curettage.
Thirty-three percent of the abortions occurred at six weeks of gestation or earlier. Thirty-five percent were performed between seven and eight weeks, and 18% were performed between nine and 10 weeks of gestation. Seven percent occurred between 11 and 12 weeks of gestation, and another 7% at 13 through 15 weeks. Five abortions were performed between 16 and 17 weeks, while 11 abortions were performed between 18 and 20 weeks. Twelve abortions were performed at or after 21 weeks of gestation. The gestational age was unknown for one abortion.
All but 32 resident abortions (99.7%) were performed in abortion centers. There were 22 abortions performed in hospitals, while the number performed in other outpatient settings was suppressed as the number was less than six abortions. Fifty-nine percent of the abortions were performed by doctors specializing in obstetrics and gynecology, and 41% were performed by doctors who specialized in general family practice. The number of abortions performed by physicians with other or multiple specialties was suppressed.
Planned Parenthood accounted for 29% of the abortions, with 53% of Planned Parenthood abortions occurring at their Glendale location and 27% at their Southern Arizona Regional Health Center (formerly the Margaret Sanger Center) in Tucson. Eighteen percent of Planned Parenthood’s abortions occurring in Arizona and obtained by Arizona residents occurred at their Tempe location, while 87 abortions were performed at their Flagstaff location. For comparison, the Tempe and Flagstaff locations reported zero abortions in 2023. Thirty-two percent of the total Arizona resident abortions occurred at Camelback Family Planning, and 19% were performed at Family Planning Associates Medical Group. Fourteen percent were performed by Acacia Women’s Center, and 4% and 2% were performed by Choices Women’s Center and Desert Star Family Planning, respectively. Additionally, six hospitals and doctors’ offices also reported abortions. From 2023 to 2024, the number of abortions performed at independent centers decreased by 16% while the number performed at Planned Parenthood increased by 87%.
Nineteen percent of the women undergoing abortions received anesthesia, while 81% did not receive anesthesia. The number of unborn babies killed by abortion who were anesthetized was suppressed, while 12,677 were not anesthetized. In Arizona, abortion facilities must report what was done with the unborn babies’ bodies. In almost every case, facilities reported that “tissue was not donated in part or whole.” The remains were delivered to a mortuary in 17 cases. No babies’ bodies were donated for research.
In 2024, there were seven reports of complications occurring during the abortion that were recorded on the procedure report form. There were 41 complications reported subsequent to the abortion procedure using the abortion complication report form.2 The number of complications by category was suppressed, but reported complications included heavy bleeding, uterine perforation, and other, unknown complications. Arizona’s state Medicaid Agency, the Arizona Health Care Cost Containment System (AHCCCS), pays for abortion in limited circumstances, and in 2024, there were three abortions paid for using Arizona state monies, totaling $6,090.35.
Arizona requires that women be given the necessary information and allowed the opportunity to give their informed consent before an abortion is performed. Arizona collects information on informed consent separately from the abortion reporting form, and the reporting requirement applies both to doctors who perform abortions and doctors who provide abortion referrals. In 2024, 17,907 women were provided with information about their procedure, while 17,272 were provided with information about their rights and alternatives available to them. Additionally, 17,916 women were given the opportunity to listen to their baby’s heartbeat or view their ultrasound. There were no reported medical emergencies creating exceptions to the informed consent requirement.
In 2024, nine babies were reported to have survived abortions; the report does not say what happened to these babies or how or if they were cared for.
Reasons for Abortion
Arizona collects the reasons for which abortions are performed, and women can give more than one reason. In 2024, 71% of the women undergoing abortions indicated the abortion was elective. Three percent of the abortions were performed due to maternal health considerations, and 0.2% were performed because of the health of the unborn baby. Approximately 0.6% of the abortions were performed due to domestic violence, and 0.2% for sexual assault. Twenty-three percent of women provided a different answer, while 33% declined to give a reason. Of the women who shared another reason for getting an abortion, 71% reported that they chose abortion because they did not wish to have children.
Separately, the report includes a table with the number of abortions performed for maternal or fetal health conditions, although it is not clear if these completely overlapped with the abortions for the health of the mother or baby. Approximately 20 abortions were performed because the baby had an unknown fetal medical condition. Approximately 370 abortions were performed because of maternal conditions, an increase of 28% from 2023. Included in the list of maternal conditions that caused women to seek an abortion were suppressed numbers of premature rupture of membranes, HELLP or preeclampsia, pre-pregnancy medical conditions, previous pregnancy complications, a recent pregnancy, a preexisting cardiovascular condition, and a current pregnancy-related medical condition. For 352 of the 370 abortions done for maternal health considerations, the condition was unknown.
Abortions by County of Residence and Occurrence
To see the number of abortions by county of residence and occurrence, see the following table.3
| # of Ab. by County of Residence, 2024 | # of Ab. Occurring in the County, 2024 | |
| Maricopa County | 9,309 | 11,047 |
| Pima County | 1,509 | 1,534 |
| Pinal County | 491 | 0 |
| Yavapai County | 138 | 0 |
| Coconino County | 130 | 87 |
| Cochise County | 67 | 0 |
| Navajo County | 55 | 0 |
| Gila County | 32 | 0 |
| Santa Cruz County | 31 | 0 |
| Graham County | 18 | 0 |
| Mohave County | 13 | 0 |
| Yuma County | 11 | 0 |
| Apache County | 11 | 0 |
| Greenlee County | 7 | 0 |
| La Paz County | 6 | 0 |
| Unknown County | 854 | 144 |
| Total | 12,682 | 12,682 |
Of the abortions performed by counties of residence, 13% of the residents resided in the border region of the state, while 81% resided in the non-border region. The state considers the border region to include the counties of Cochise, Pima, Santa Cruz, and Yuma.
2024 Guttmacher Data
In 2024, Guttmacher estimated that 17,010 abortions occurred in Arizona, while the state reported 12,823. Guttmacher also estimated that 240 abortions were obtained by women who traveled to Arizona to get an abortion in 2024. One-hundred and fifty women traveled from Texas, and 90 women traveled from an unknown state or territory. The 240 abortions are included within Guttmacher’s total estimate of 17,010 abortions occurring in the state. Guttmacher also estimated the number of abortions obtained by Arizona women who traveled to other states for their abortions (1,750). To see the number of abortions obtained by Arizona women in various states, see below.5
| States Traveled to by Arizona Women | # of Abortions Obtained by Arizona Women Who Traveled to Other States to Get Abortions, 2024 |
| New Mexico | 180 |
| Nevada | 550 |
| California | 1,020 |
| Total | 1,750 |
When looking at the totals estimated by Guttmacher and those reported by the state, one can see a large discrepancy between the totals. To see those discrepancies further highlighted, see the following table:

One possible explanation for these differences is that Guttmacher’s estimates include abortions occurring at brick-and-mortar facilities and telehealth abortions occurring under shield laws from other states. Telehealth abortions in Arizona are illegal if prescribed by Arizona providers. However, other states utilize their own shield laws to ship abortion drugs into Arizona. The state’s estimates do not capture such abortions occurring under shield laws. Data from the Society of Family Planning (SFP) provides more context. Their #WeCount project estimated that of the 17,030 abortions that occurred in the state in 2024, 12,970 were performed in person at brick-and-mortar facilities, and 4,060 were obtained via mail-order abortion drugs.6 The discrepancies between Guttmacher (4,187) and #WeCount (4,207) and the state’s total abortions estimates appear to be almost completely explained by the state’s exclusion of mail-order estimates.
State Ranking
In 2024, CLI published a paper reevaluating abortion reporting across the country, with Arizona ranked as the best state in the country in terms of completeness and ease of access to the state’s abortion data. As CLI has previously suggested, Arizona could continue to improve its reporting by ensuring that all health care providers are aware of the state requirement to report abortion complications they treat, particularly in emergency rooms and other urgent care facilities. Additionally, the state could provide more details on babies who survive abortions.
- National rates were calculated by the Guttmacher Institute. Arizona rates were calculated by CLI using the following formula: (total number of abortions performed in Arizona ÷ number of resident women ages 15-44 [based on most recent population estimates]) x 1,000. Rates may differ slightly from previous CLI articles due to revised population estimates. Population estimates were obtained from the CDC WONDER database. Estimates for 2005-2009 are intercensal estimates of the July 1 resident population. Estimates for 2010-2019 are Vintage 2020 postcensal estimates of the July 1 resident population. Estimates for 2020-2024 are Vintage 2024 postcensal estimates of the July 1 resident population. Estimates were produced by the U.S. Census Bureau and the National Center for Health Statistics.
- Statistics on abortion complications reported here represent a minimal number of deaths and complications, as this data is collected in a non-systematic and non-verifiable way. As such, this data cannot be used to calculate either an accurate abortion mortality rate or an accurate abortion complication rate for the state.
- The number of abortions performed in the mentioned counties could have been obtained by nonresidents and residents alike, and the inclusion of the two categories of data does not mean that Arizona residents from a county where abortions occurred necessarily got an abortion in that county (as the report doesn’t include that confirmation). The different data points are included to give the reader some general context about the supply and demand for abortion in the counties.
- The number of abortions performed in hospitals was suppressed for four hospitals in Maricopa County and one in Pima County. Because the numbers were suppressed, those counts were not included in the counties’ totals in this column, but rather in the unknown/suppressed row.
- The Guttmacher Institute notes that their monthly abortion totals by state are estimates and that each state’s estimate is within a range of uncertainty. Guttmacher also notes that their estimates do not reflect abortions obtained by women in states with total abortion bans under shield laws in effect in pro-abortion states. Guttmacher’s travel and residence data can be found in the CSV folder here (State_Abortion_Travel_2024.csv). This information is updated as of January 6, 2025.
- #WeCount’s data can be found here by downloading the “Report data tables [.xlsx]” document. The #WeCount report specifies that the numbers included in their tables for abortions performed under shield laws only represent the number of women whom abortion drugs were sent to, not the number of drug-induced abortions that resulted from the mailed drugs. However, because #WeCount’s data is the only source of data that delineates the number of abortions by mode of provision (in-person, telehealth/mail order, and/or abortion drugs obtained under shield laws), their data is the best available.
Click here to view reporting from:2023202220212020201920182017