Abortion Reporting: Oregon (2023)
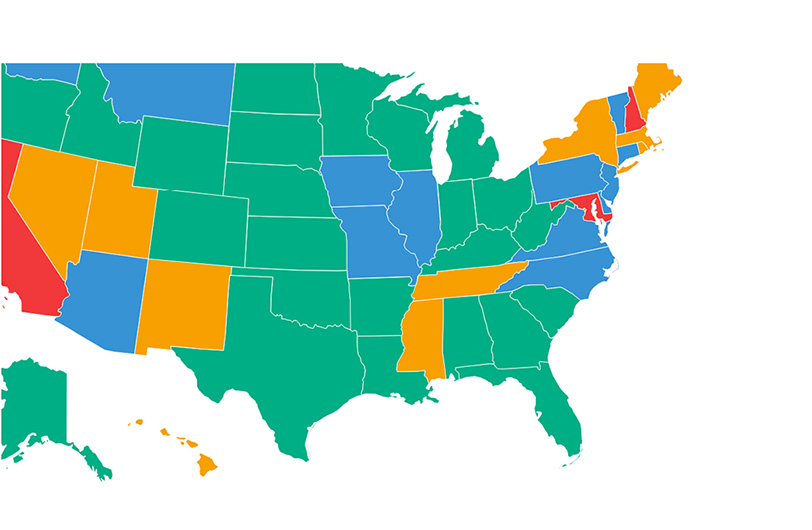
Oregon’s 2023 abortion statistics were published in November 2024 on the state’s Induced Abortion Dashboard run by the Oregon Health Authority’s Center for Health Statistics. During 2023, reported abortions in the state increased from 2022. As of November 2024, 21 states had released 2023 abortion statistics, nine of which showed an increase in abortions from 2022.
Statistics and Changes in Oregon Abortions, 2022-2023

The report does not include information on Planned Parenthood’s Oregon abortion market share.
Abortion Totals and Trends
A total of 10,075 abortions were reported in Oregon in 2023, an increase of 16% from 2022 and the highest total recorded by the state since 2009 when there were 10,801 abortions reported. There were 6,571 drug-induced abortions in 2023, constituting 65% of the total and an increase of 20% from 2022 (Fig. 1). The abortion rate increased 16% from 10.4 abortions per 1,000 women of childbearing age in 2022 to 12.1 in 2023 (Fig. 2).1
State Report Summary
In 2023, 84% of the abortions reported in Oregon were performed on state residents. Sixteen percent of the abortions (1,661 abortions) were performed on nonresident women, with the number increasing by 60% from 2022 when there were 1,036 nonresident abortions. The total number of abortions in the state includes 90 telehealth abortions, including those from licensed providers located out of state, a 48% decrease from 2022 when 172 telehealth abortions occurred.
Eleven percent of the abortions were performed on girls ages 19 or younger, including 22 abortions on girls less than 15 years old (0.2% of the total number of abortions). Fifty-six percent of Oregon abortions were obtained by women in their twenties, 30% by women in their thirties, and 4% by women ages 40 or older. A majority of women who obtained abortions in Oregon in 2023 had at least a high school diploma or a GED equivalent, with 28% having this as their highest level of educational attainment. Twenty percent of these women attended some college but did not obtain a degree. Ten percent had a bachelor’s degree, 7% had an associate degree, and 3% had a master’s degree. Two percent of women who received abortions in Oregon had an eighth grade education or less and one percent had a doctorate or other professional degree. The level of education was not known for 21% of the women.
Oregon reports abortions by race, but because more than one race may be selected on the abortion reporting form, the total of the figures for each race are higher than the total number of abortions that occurred in Oregon. Sixty-six percent of abortions were performed on white women, and 9% on Black/African American women. Five percent of abortions were performed on Asian women and 3% and 1%, respectively, on American Indian/Alaska Native and Native Hawaiian/Pacific Islander women. Eight percent of women who obtained abortions in 2023 reported their race as “other,” and race was unreported for 7% of the abortions. The Charlotte Lozier Institute (CLI) estimates that the black abortion rate (43.4 abortions per 1,000 women ages 15 to 44) was over four times higher than the white abortion rate (9.6). Twenty-seven percent of Oregon abortions were obtained by Hispanic women of any race.
A majority (65%) of the abortions performed in Oregon were drug-induced. Suction curettage abortions accounted for 23% of the state’s total abortions and dilation and evacuation abortions accounted for 9%. Two percent of the abortions were sharp curettage abortions, and five abortions were performed using vaginal prostaglandins. There were 15 hysterotomies/hysterectomies and 1% of the abortions were performed by other, unspecified means.
Sixteen percent of the abortions reported in Oregon were performed on women who were married, separated, or in a domestic partnership. Sixty-eight percent were performed on unmarried women. Marital status was unknown for 16% of the women. Fifty-four percent had no living children, 20% had one living child, and 25% had two or more living children. A majority of abortions were performed on women who had never had an abortion (65%). Twenty percent had one prior abortion, and 14% had more than one.
Thirty-eight percent of the abortions occurring in Oregon were performed on women who reported using contraception, while 62% were performed on women who were not using any contraception when they became pregnant. Eight percent of the abortions were performed on women who reported using oral contraception and 9% on women who used condoms. Three percent of women used emergency contraception, 1% used the rhythm method, and another 1% used contraceptive rings. Two percent of women used multiple contraceptive methods while 9% did not report whether they were using contraception.
Seventy-five percent of reported abortions were performed before nine weeks of gestation, and 14% occurred between nine and 12 weeks. Four percent were performed between 13 and 16 weeks and 3% between 17 and 20 weeks. Unlike the decrease in abortions between 13 and 20 weeks of gestation from 2022 to 2023, the number of abortions performed at 21 weeks of gestation and later increased by 95%. One hundred and nine abortions were performed between 21 and 22 weeks in 2023 (86 were performed in 2022) and 225 were performed at 23 weeks or later. The number of abortions performed at 23 weeks or later increased by 165% from 2022 to 2023. The gestational age was not reported for 1% of the abortions. Oregon has no limits on how late in pregnancy an abortion may be performed.
Abortion-Related Complications
In 2023, abortions at later gestational ages had the highest rates of reported complications. 2 Of the abortions performed at nine weeks of gestation or earlier, Oregon reported that 5% resulted in complications. Abortions performed between nine and 12 weeks resulted in complications 6% of the time. For abortions performed between 13 and 16 weeks and abortions performed between 17 and 20 weeks, 9% of abortions resulted in complications for each gestational age period. Furthermore, 13% of the abortions between 21 and 22 weeks and another 13% of abortions performed at 23 weeks or later resulted in complications. Overall, the risk of abortion complications increases with gestational age.
Retained products was the most common complication, occurring 116 times. There were 110 cases in which the abortion method failed, 55 cases of hemorrhage, 24 cases of infection, and nine cases of cervical lacerations. Seventy women experienced multiple complications. There were 159 unspecified complications, accounting for 29% of total complications.
Abortions Performed by County of Occurrence
Abortions were performed in 13 of Oregon’s 36 counties. Following is a breakdown of the number of abortions occurring in Oregon by county in 2022 versus 2023, as well as the number of brick-and-mortar abortion providers located within the county:3
| # of Abortions (2023) | # of Abortions (2022) | # of Brick-and-Mortar Abortion Providers in County as of 20234 | |
| Benton County | 42 | 25 | 0 |
| Clackamas County | 725 | 552 | 1 |
| Columbia County | 9 | 0 | 0 |
| Deschutes County | 591 | 662 | 1 |
| Jackson County | 377 | 516 | 1 |
| Josephine County | 65 | 99 | 1 |
| Lane County | 787 | 780 | 2 |
| Lincoln County | 4 | 10 | 0 |
| Malheur County | 427 | 0 | 1 |
| Marion County | 962 | 755 | 1 |
| Multnomah County | 4982 | 4020 | 4 |
| Wasco County | 1 | 0 | 0 |
| Washington County | 1013 | 1081 | 1 |
| Remote Telehealth | 90 | 172 | – |
| Total | 10075 | 8672 | 13 |
As the table above displays, the increase in abortions performed in the state between 2022 and 2023 is a result of a significant increase in abortions performed in Clackamas, Marion, and Multnomah Counties as well as a new Planned Parenthood location which opened in Malheur County in early 2023. The new location is located very close to the border of Idaho which prohibits abortion except in limited cases, but the report does not detail if all the abortions performed in the county were performed at this location or the state of residence of the women who obtained abortions in the county. The increase in abortions performed in the state from 2022 to 2023 was also driven by the large increases in abortions performed at multiple gestational ages (<9 weeks and 21+ weeks).
Abortion Provider Breakdown in Oregon:4
| # of brick-and-mortar locations | 13 |
| # of independent centers | 1 |
| # of Planned Parenthood centers | 11 |
| # of hospitals/doctors’ offices that perform abortions | 1 |
| # of abortion drug providers | 13 |
| # of abortion drug-only providers | 5 |
| # of surgical and abortion drug providers | 8 |
| # of online mail-order abortion drug companies licensed in the state | 9 |
| # of brick-and-mortar locations that also mail abortion drugs | 1 |
| Latest gestational age that a center performs surgical abortion | Through 33 weeks |
State Ranking
In 2024, CLI published a paper reevaluating abortion reporting across the country, with Oregon ranking 16th best. To improve, Oregon could be more transparent in reporting data it already collects, such as the facilities where abortions take place, de-identified data on the state of residence of nonresident women who obtain abortions in the state, as well as previous miscarriages experienced by women who undergo abortions. Oregon could also collect and report information on the methods of payment used to fund abortion, as well as women’s reasons for choosing abortion. Oregon could further require all healthcare providers, including those in emergency rooms, to report any abortion complications they encounter. As Oregon’s complications statistics illustrate, abortions become dangerous for women as gestational age increases, and Oregon permits abortion throughout all nine months of pregnancy.


- National rates were calculated by the Guttmacher Institute. Oregon rates were calculated by CLI using the following formula: (total number of abortions performed in Oregon ÷ number of resident women ages 15-44 [based on most recent population estimates]) x 1,000. Rates may differ slightly from previous CLI articles due to revised population estimates. Population estimates were obtained from the CDC WONDER database. Estimates for 2005-2009 are intercensal estimates of the July 1 resident population. Estimates for 2010-2019 are Vintage 2020 postcensal estimates of the July 1 resident population. Estimates for 2020-2022 are Vintage 2022 postcensal estimates of the July 1 resident population. Estimates were produced by the U.S. Census Bureau and the National Center for Health Statistics. Rates for 2023 were calculated using the Vintage 2022 postcensal estimates because 2023 population estimates have not yet been released by the CDC.
- Statistics on abortion complications reported here represent a minimal number of deaths and complications, as this data is collected in a non-systematic and non-verifiable way. As such, this data cannot be used to calculate either an accurate abortion mortality rate, or an accurate abortion complication rate for the state.
- The number of providers is included in this section not to say that the abortions occurring in the mentioned counties were certainly performed by the providers in the county (as the report doesn’t include that confirmation) but rather to give the reader some general context about abortion access in the counties. Provider totals do not include hospitals or physician offices not listed in databases that compile abortion provider locations in different states, but do include Planned Parenthood locations, independent abortion centers, and hospitals/doctor’s offices included in databases like Abortion Finder and Ineedana.
- This information is updated as of November 18, 2024.


