Abortion Reporting: Tennessee (2020)
Tennessee’s 2020 abortion statistics, published in March 2023 by the Tennessee Department of Health, indicate that Tennessee abortions increased from 2019.
Statistics and Changes in Tennessee Abortions, 2019-2020

The change in total abortions and the abortion rate reflect all abortions occurring in Tennessee. Information on the number of chemical abortions performed in Tennessee and Planned Parenthood’s Tennessee abortion market share is not included in the abortion report.
Abortion Totals and Trends
In 2020, there were 11,243 abortions reported in Tennessee, an increase of 15.7 percent from the previous year (Fig. 1). There were 10,582 abortions performed on Tennessee residents, both in Tennessee and in other states, an increase of 21.3 percent from 2019. The report does not state the number of chemical abortions occurring in Tennessee, although the state collects this data. The Charlotte Lozier Institute (CLI) estimates that Tennessee’s state abortion rate increased by 14.8 percent in 2020 to 8.4 abortions per 1,000 women ages 15 to 44 (Fig. 2), still well below the national abortion rate.
State Report Summary
Tennessee’s abortion report contains information for abortions performed on Tennessee residents only; it does not report information for abortions performed on women from other states. The report includes Tennessee resident abortions occurring both inside and outside Tennessee. Because not all states share abortion data with Tennessee, the report likely does not include all abortions performed on Tennessee residents. In 2020, 86 percent of the Tennessee resident abortions reported to the state health department took place in Tennessee.
Eight percent of the abortions performed on Tennessee residents in 2020 were on girls ages 19 and younger, including two percent on girls under the age of 18. Twenty-eight percent were performed on women in their early twenties, and 31 percent were on women in their later twenties. Thirty percent of the abortions were obtained by women in their thirties, and three percent were performed on women in their early forties. Age was not reported for 46 abortions.
Fifty-one percent of Tennessee resident abortions were performed on black women, while 43 percent were on white women and seven percent on women of other or unknown races. CLI estimates that the 2020 Tennessee black abortion rate was four-and-a-half times higher than the white abortion rate. Ninety-one percent of the abortions were obtained by non-Hispanic women, seven percent were on Hispanic women, and two percent were performed on women of unknown ethnicity.
Seventy-five percent of the abortions were performed on women who were unmarried. Twelve percent were on married women, and 13 percent were on women of unknown marital status. A majority of the women undergoing abortions (67 percent) reported no prior abortions, while 22 percent of the abortions were performed on women with one previous abortion, and 11 percent were performed on women with two or more prior abortions. The number of previous abortions, if any, was not reported for 40 women.
Over half of Tennessee resident abortions (58 percent) occurred at eight weeks of gestation or earlier; just under 26 percent were performed before seven weeks, and almost 33 percent were reported between seven and eight weeks. Twenty-two percent of the abortions were performed between nine and 10 weeks, dropping to nine percent between 11 and 12 weeks. Five percent occurred between 13 and 14 weeks. Three percent were performed between 15 and 16 weeks, and another three percent were reported between 17 and 20 weeks of gestation. Eighty-two abortions occurred at unknown gestational ages.
Unlike previous years, this report did not include abortion complications from the Tennessee Hospital Discharge Data System. Similar to years past, this report also did not include complications that were treated in facilities other than hospitals. This report will be updated if Tennessee publishes its complication data, as required by state law.
Legislative Changes in Tennessee
After the United States Supreme Court overturned Roe v. Wade in June 2022, Tennessee’s heartbeat and life-at-conception laws went into effect on June 28, 2022. The Tennessee heartbeat law was passed in 2020 and its life-at-conception law was passed in 2019. The life-at-conception law was not allowed to go into effect unless and until Roe v. Wade was overturned. The heartbeat law never went into effect after passage as it was blocked by a lower court. However, that injunction was lifted by the federal Sixth Circuit Court of Appeals on June 28, 2022, and the law immediately went into effect. Prior to these laws being enacted, Tennessee limited abortion to viability despite the efforts of state officials who passed and signed legislation in 2020 that prohibited abortion at varying gestational ages from six to 24 weeks’ gestation. However, that legislation (which included the heartbeat provision) was blocked on July 13, 2020.
State Ranking
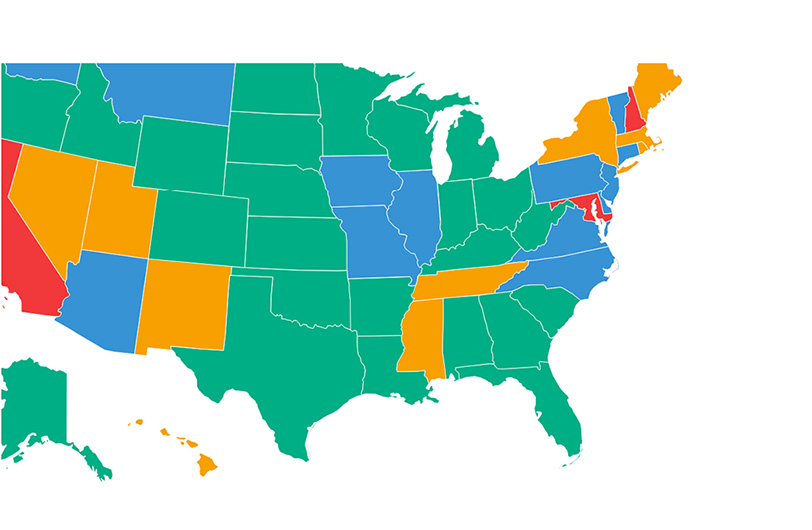
In 2016, CLI ranked abortion reporting across the 50 states, the District of Columbia, and New York City, and Tennessee tied for 33rd best. To improve its reporting, Tennessee could include information on all abortions performed in the state and report the types of procedures used, data which it already collects. Tennessee could also report all information that it collects to the CDC’s abortion reporting system. Lastly, Tennessee could also require complication reporting from all medical facilities, including nonhospital facilities.


- Statistics on abortion complications reported here represent a minimal number of deaths and complications, as this data is collected in a non-systematic and non-verifiable way. As such, this data cannot be used to calculate either an accurate abortion mortality rate or an accurate abortion complication rate for the state.
- Rates were calculated by CLI using the following formula: (total number of abortions performed in Tennessee ÷ number of resident women ages 15-44) x 1,000. Rates may differ slightly from previous CLI articles due to revised population estimates. Population estimates were obtained from the CDC WONDER database. Estimates for 2005-2009 are intercensal estimates of the July 1 resident population. Estimates for 2010-2020 are Vintage 2020 postcensal estimates of the July 1 resident population. Estimates were produced by the U.S. Census Bureau and the National Center for Health Statistics.


