
















Connecticut’s 2025 abortion report was provided to the Charlotte Lozier Institute (CLI) by the Connecticut Department of Public Health (CDPH) upon request in August 2026. For the first time since CLI started requesting this data in 2017, the abortion data provided by the CDPH only represented abortions performed in outpatient “clinics.” In the past, CDPH had provided data on abortions performed in outpatient clinics, licensed practitioners’ offices, hospitals, and other facilities. In 2024, abortions occurring in Connecticut in facilities that were not outpatient clinics accounted for around 9% of the state’s total reported abortions.
The data published by the state also does not include the total number of abortions obtained by Connecticut residents out of state or the number of self-managed abortions on women outside of the healthcare system. The report also does not contain the number of mail-order abortion drugs obtained by Connecticut residents prescribed by licensed abortion providers in Connecticut or in other states. In a separate section, CLI will describe data provided by the Guttmacher Institute’s Monthly Abortion Provision Study (MAPS) and the Society of Family Planning’s (SFP) #WeCount project detailing the number of mail-order abortions obtained by Connecticut residents from in- and out-of-state prescribers. CLI will also describe Guttmacher’s estimated number of abortions obtained by Connecticut women in other states.
Connecticut’s statute code defines abortion as “termination of a pregnancy for purposes other than producing a live birth. Abortion includes, but is not limited to, a termination of pregnancy using pharmacological agents” (CT Gen. Stat. §19a-912).
In Connecticut, abortion is widely available throughout pregnancy because of the state’s ineffective gestational limit at viability. While the language of the law limits abortion after viability, the law contains a broad health (life and health of the mother) exception that doesn’t differentiate between physical and mental health, which, in turn, allows abortion throughout pregnancy for nearly any reason (CT Gen. Stat. §19a-602).
Statistics and Changes in Connecticut Abortions, 2024-2025

Abortion Totals and Trends
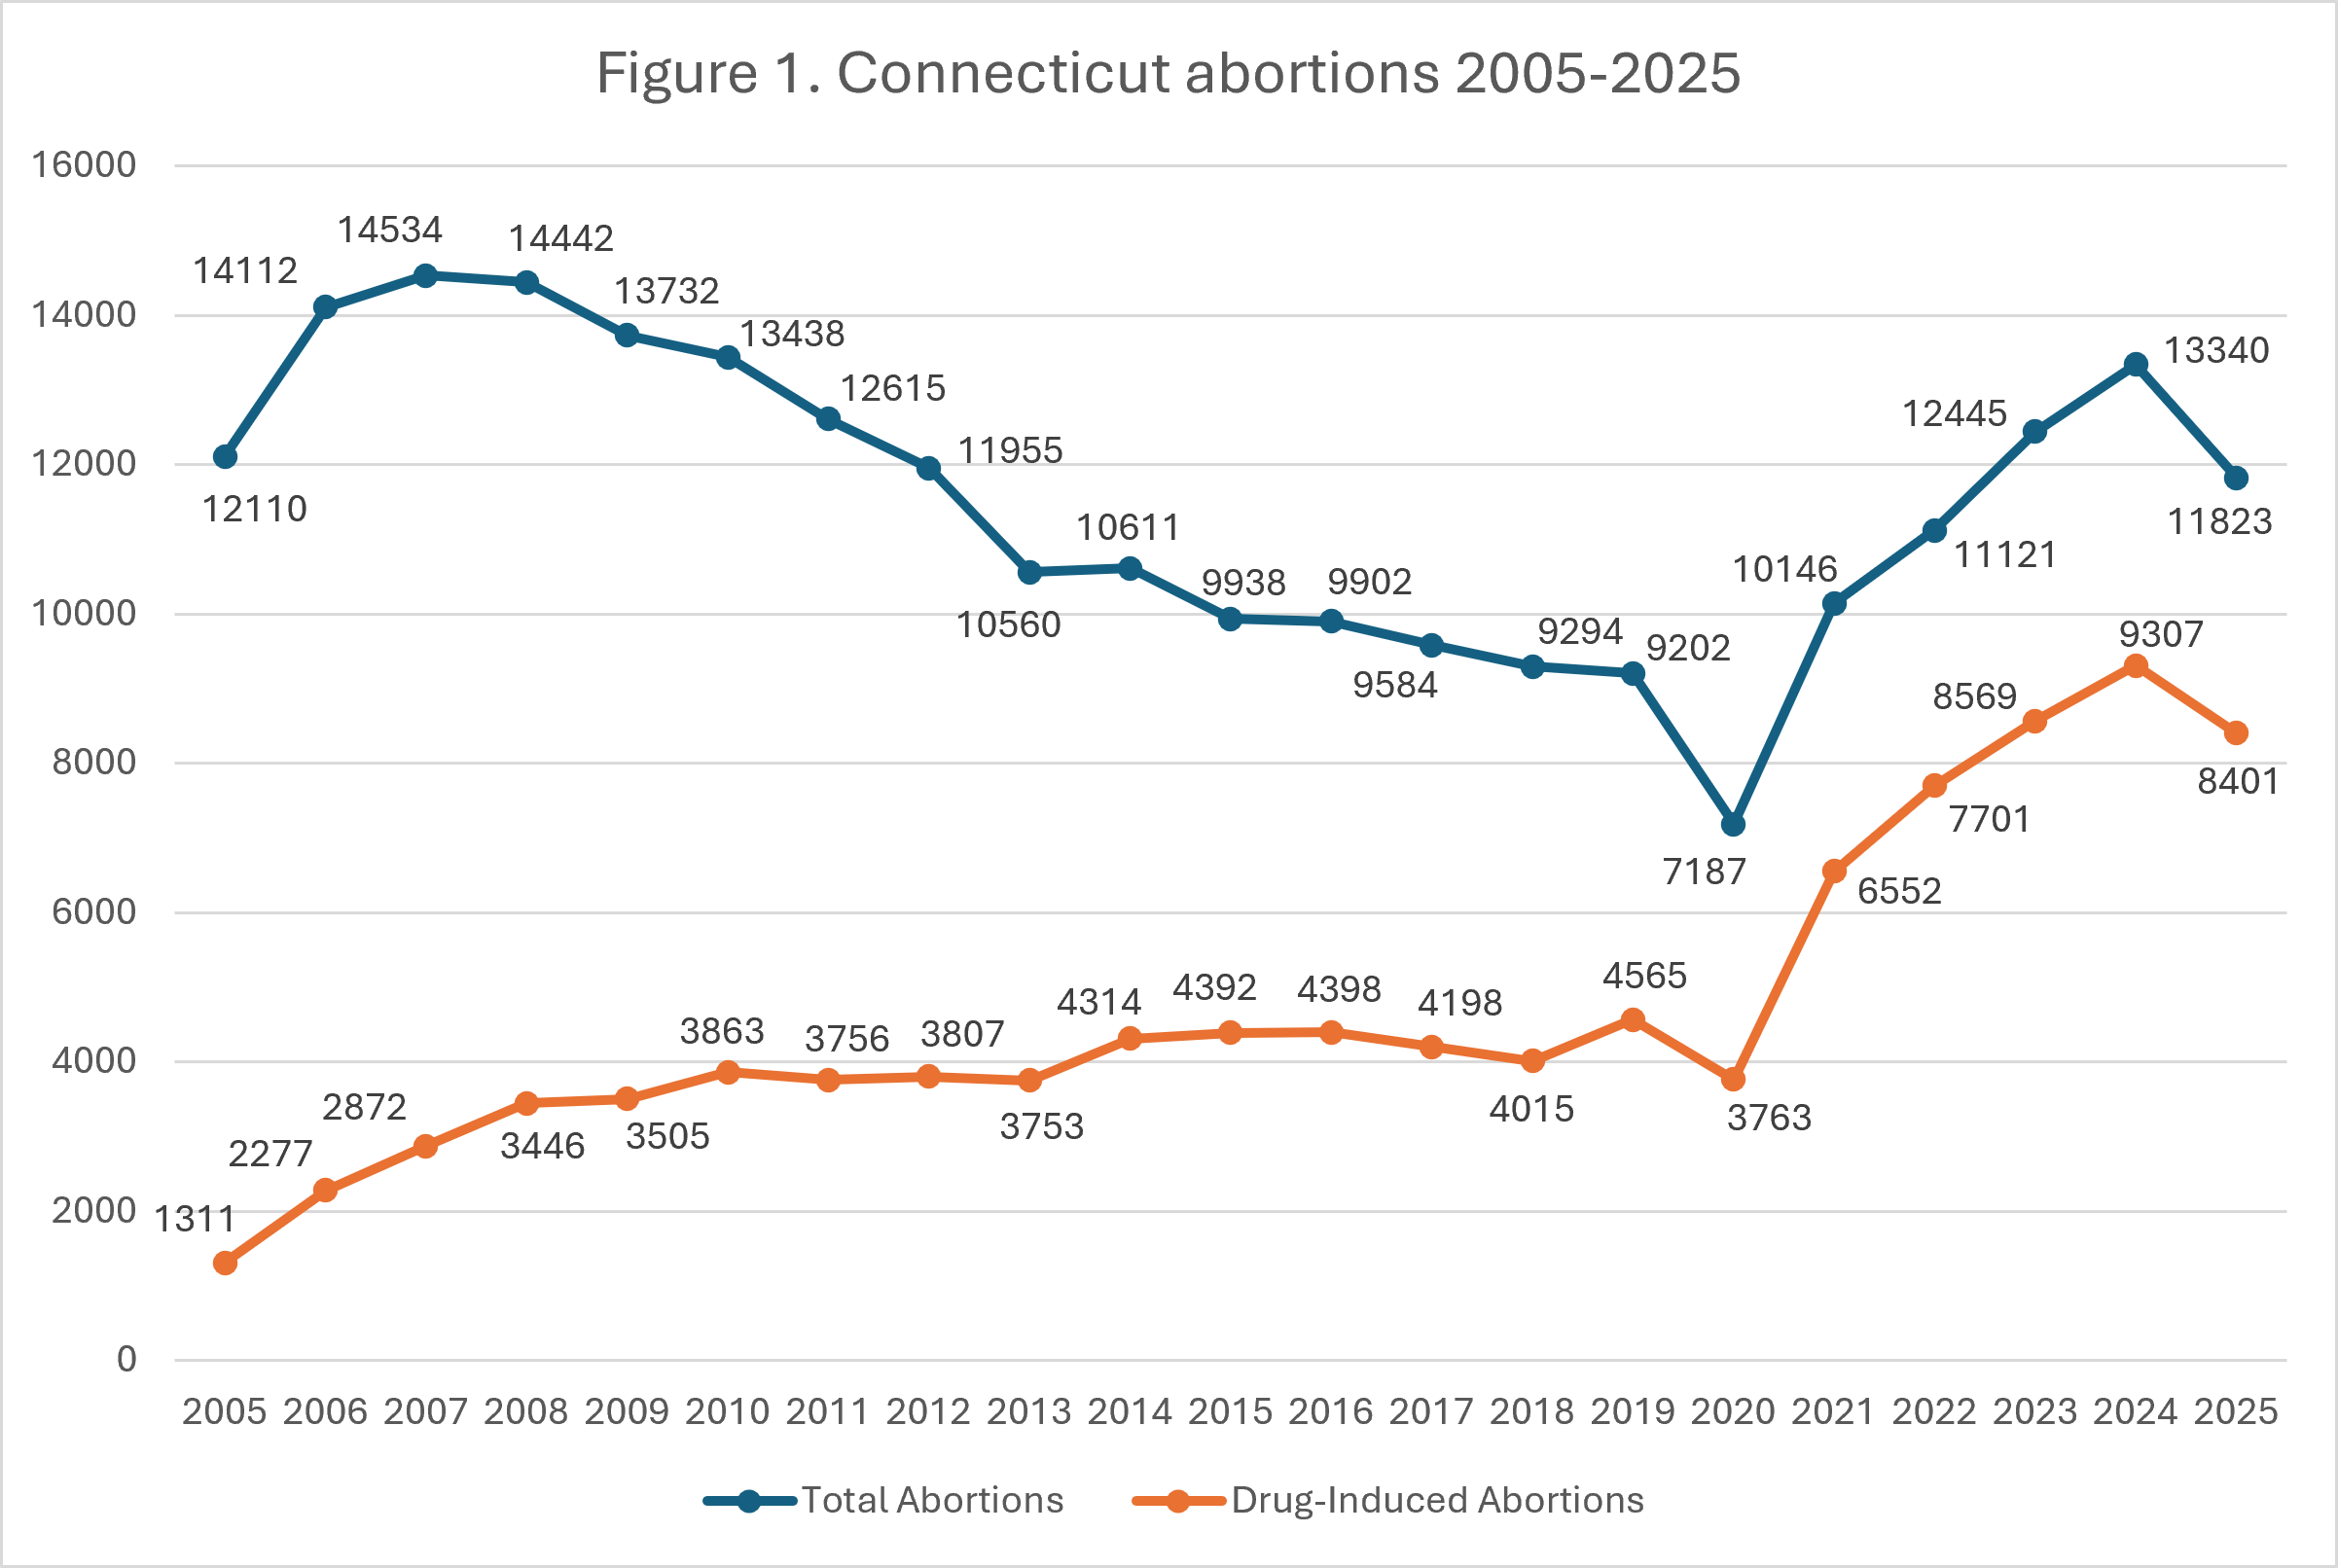
There were 11,823 brick-and-mortar abortions reported in Connecticut in 2025, down 11% from 2024 when 13,340 abortions were reported. Drug-induced abortions decreased by 10% from 2025, going from 9,307 in 2024 to 8,401 in 2025 (Fig. 1). CLI estimates that Connecticut’s abortion rate was 16.7 abortions per 1,000 women ages 15 to 44, a decrease of 11% from 2024 (Fig. 2).1 As of October 2026, 15 states had released 2025 abortion reports, with five showing decreases in abortion totals from the previous year.
State Report Summary
In early 2023, the Connecticut DPH issued a new abortion reporting form for abortionists to use without the adoption of revised regulations by the Legislature’s Regulations Review Committee. Seven of the nine reporting categories previously included in the 2007 version of the form no longer existed on the 2023 version of the form. However, in 2025, the state also stopped reporting two additional categories of data: abortions by type of facility and abortions by specific states of residence.
Ninety-five percent Connecticut abortions were reported to have been performed on state residents. Five percent of Connecticut abortions were obtained by nonresidents of unspecified states. Seventy-one percent of Connecticut abortions were drug-induced, while 29% were surgical/aspiration abortions. Both the number of surgical/aspiration abortions and drug-induced abortions decreased from 2024.
In 2025, 22% of abortions were performed by physicians, and 36% were performed by advanced practice registered nurses. Twenty-four percent were performed by licensed nurse midwives, while 19% were performed by physician assistants.
Breakdown of Abortion Providers in Connecticut2
| # of brick-and-mortar locations | 20 |
| # of independent centers | 1 |
| # of Planned Parenthood centers | 14 |
| # of hospitals/doctors’ offices that perform abortions | 5 |
| # of abortion drug providers | 20 |
| # of abortion drug-only providers | 12 |
| # of surgical and abortion drug providers | 8 |
| Latest gestational age that a center performs surgical abortion | Through 23 weeks |
These abortion provider totals were current as of October 5, 2026. This does not reflect the breakdown of providers available in Connecticut during the period that Connecticut’s abortion report covers (2025).
Guttmacher Data3
Guttmacher estimated that in 2025, 15,050 abortions occurred in Connecticut, in contrast to the state’s reported total of 11,823. According to Guttmacher, of the 15,050 abortions estimated to have occurred in 2025 in Connecticut, 850 were obtained by nonresidents or those whose residence was unknown, compared to the state’s reported total of 626. To see the estimated number of women traveling to Connecticut from different states to obtain an abortion, see below:
- 200 women from Massachusetts traveled to Connecticut
- 240 women from New York
- 210 women from Rhode Island
- 200 women from unknown states
To see the differences between Guttmacher’s Connecticut estimates and the state’s reported totals, see below:

Additionally, in 2025, #WeCount estimated that 14,720 abortions occurred in Connecticut. SFP estimated that 12,510 abortions were obtained in person, while 1,850 were obtained via virtual-only organizations who ship mail-order abortion drugs within or into the state, and 360 abortions were obtained via hybrid brick-and-mortar telehealth organizations.4 In 2026, the CDPH told CLI via email that they do not collect the number of telehealth abortions to include in their abortion totals. This could partially explain why Guttmacher’s and #WeCount’s abortion estimates for Connecticut are much higher than the state’s reported total. The other reason the state’s reported total is lower than Guttmacher’s and #WeCount’s estimates is because the latter two organizations include all abortions performed in the state, not just those at outpatient clinics as the state did in 2025.
State Ranking
In 2024, CLI published a paper reevaluating state abortion reporting across the country, with Connecticut tied for 36th best out of 52 reporting areas. This ranking would likely decrease if reevaluated today due to Connecticut’s change to its abortion reporting requirements. To improve its reporting, Connecticut could report the categories of data it eliminated in 2023 and 2025, as well as report demographic information that is reported by many other states, including the race, education, pregnancy history, and marital status of those who obtain abortions.
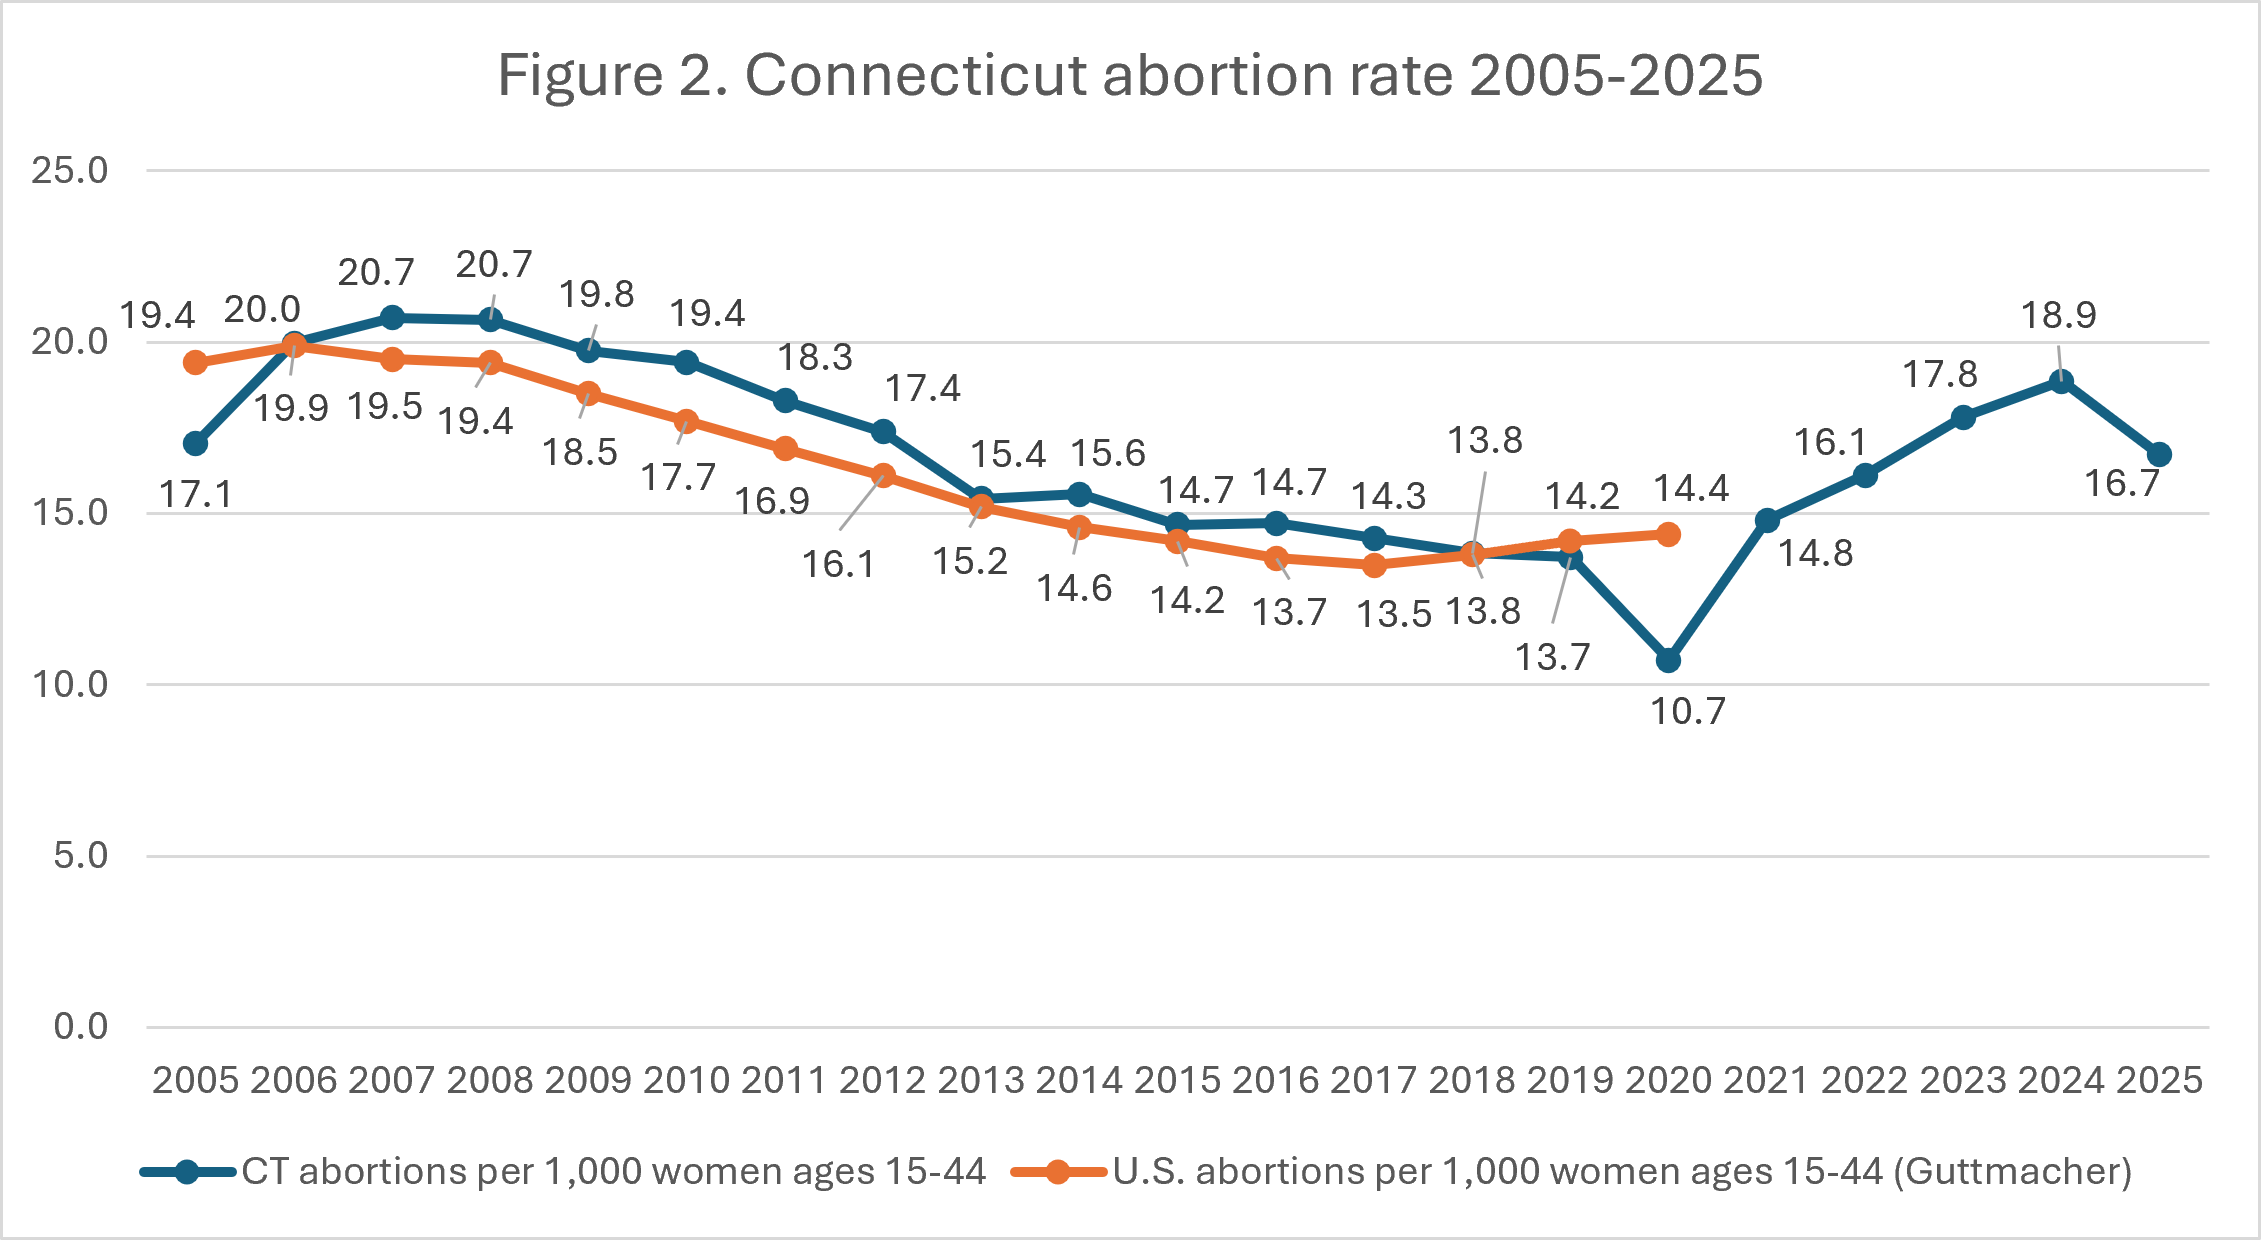
- National rates were calculated by the Guttmacher Institute. Connecticut rates were calculated by CLI using the following formula: (total number of abortions performed in Connecticut ÷ number of resident women ages 15-44 [based on most recent population estimates]) x 1,000. Rates may differ slightly from previous CLI articles due to revised population estimates. Population estimates were obtained from the CDC WONDER database. Estimates for 2005-2009 are intercensal estimates of the July 1 resident population. Estimates for 2010-2019 are Vintage 2020 postcensal estimates of the July 1 resident population. Estimates for 2020-2025 are Vintage 2024 postcensal estimates of the July 1 resident population. Estimates were produced by the U.S. Census Bureau and the National Center for Health Statistics. Rates for 2025 were calculated using the Vintage 2024 postcensal estimates because 2025 population estimates have not yet been released by the CDC.
- Provider totals do not include hospitals or physician offices not listed in databases that compile abortion provider locations in different states, but do include Planned Parenthood locations, independent abortion centers, and hospitals/doctors’ offices included in databases like Abortion Finder and ineedana. This information was up to date as of October 5, 2026.
- The Guttmacher Institute notes that their monthly abortion totals by state are estimates and that each state’s estimate is within a range of uncertainty. Guttmacher’s travel data can be found in the CSV folder here (State_Abortion_Travel_2023_2024_2025). This information was updated as of October 5, 2026.
- #WeCount’s data can be found here by downloading the “Report data tables [.xlsx]” document. The #WeCount report specifies that the numbers included in their tables for abortions performed under shield laws only represent the number of women to whom abortion drugs were sent, not the number of drug-induced abortions that resulted from the mailed drugs. However, because #WeCount’s data is the only source of data that delineates the number of abortions by mode of provision (in-person, telehealth/mail order, and/or abortion drugs obtained under shield laws), their data is the best available. This information was updated as of October 5, 2026.
Click here to view reporting from:2024202220212020201920182017